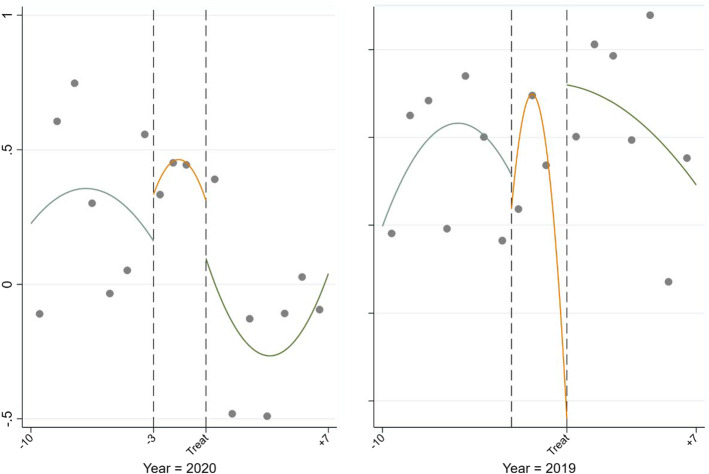
Fig. 2.
AQI of Wuhan. Note This figure plots the distributions of AQI of Wuhan city against date. The left and right graphs present the result in 2020 or 2019 around the lunar calendar date of official locked down day, respectively. The lunar calendar date of official locked down day of cities in 2020 is normalized to 0

