
Figure 9. . Treatment.
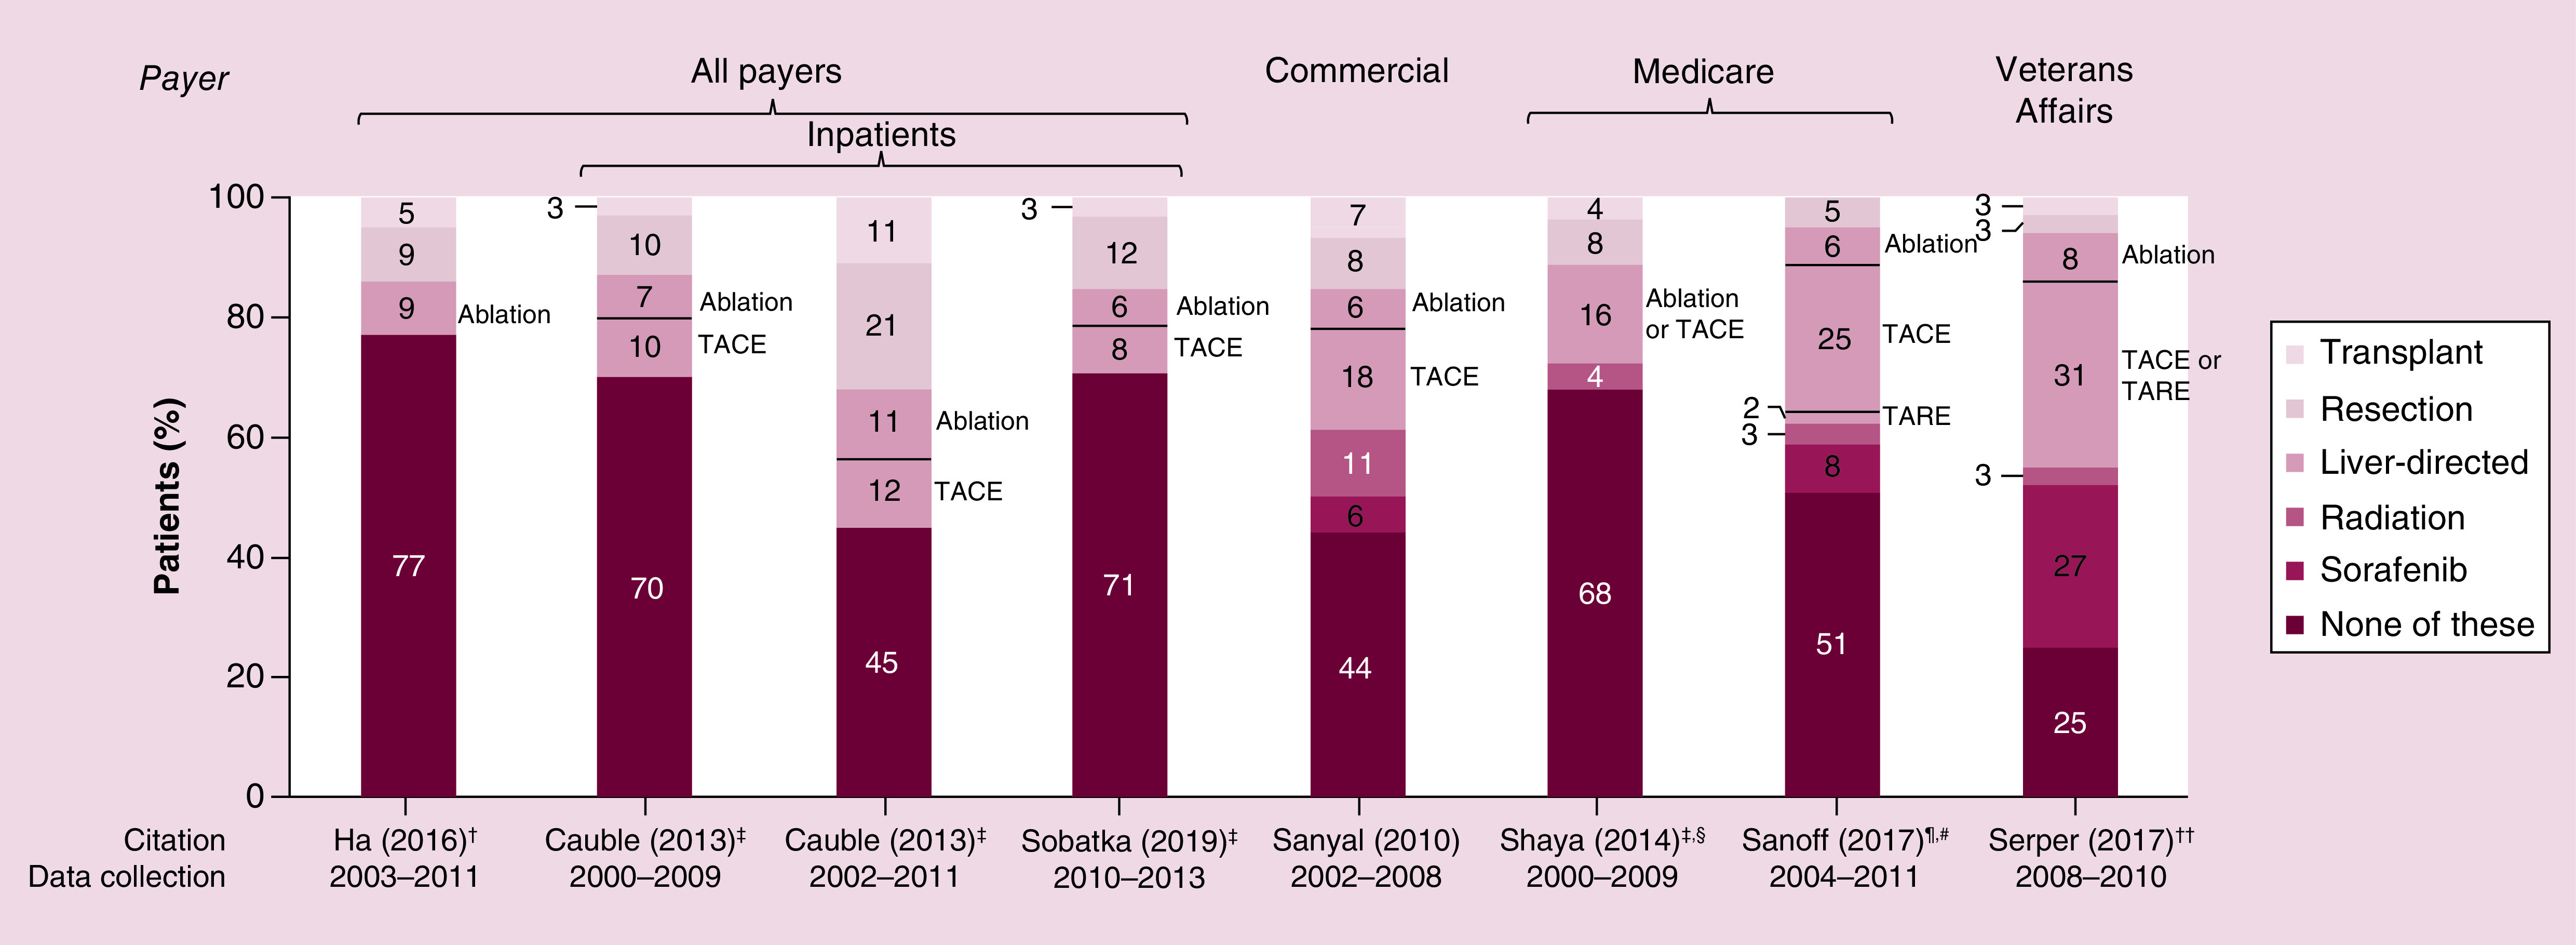
Each bar represents treatment utilization within a given study cohort. Text adjacent to each bar notes the specific liver-direct treatment used, as described by study authors.
†Treatment categories considered in analysis were transplant, resection, ablation, or none.
‡Most invasive treatment listed if patient underwent multiple procedures.
§Sorafenib was not considered in analysis.
¶Initial treatment.
#Data from subset of patients in which sorafenib and radiation were separated were used for this figure.
††Treatments not mutually exclusive.
NIS: National Inpatient Sample; SEER: Surveillance, Epidemiology and End Results; TACE: Transarterial chemoembolization; TARE: Transarterial radioembolization; UHC: University Health Consortium; UNOS: United Network on Organ Sharing.
Sources: Cauble, 2013 [55]; Ha, 2016 [77]; Sanoff, 2017 [69]; Sanyal, 2010 [20]; Serper, 2017 [79]; Shaya, 2014 [70]; Sobotka, 2019 [72].