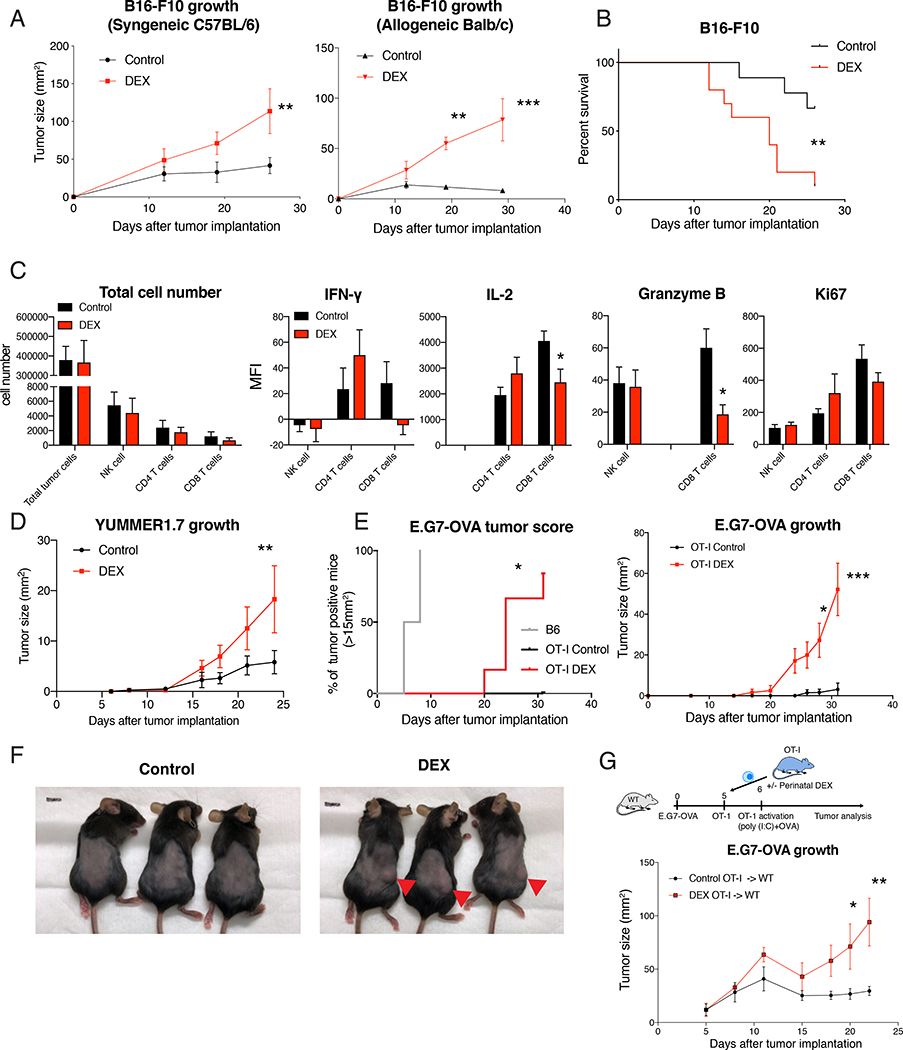
Figure 2. Perinatal GC exposure led to enhanced tumor growth and reduced anti-tumor CD8 T cell response in adulthood.
(A) B16-F10 melanoma growth in 12 week-old syngeneic B6 mice (left, n=7–8/group (male), representative of 3 independent experiments (repeated in females)) or allogenic Balb/c mice (right, n=4/group (male), representative of 2 independent experiments including females). (B) Survival of mice after B16-F10 tumor implantation (n=9–10/group (male)). (C) B16-F10 melanoma was harvested from 13 week old B6 mice after 7 days of tumor implantation, digested with collagenase IV, and analyzed with flow cytometry (after gating on single cells/live/CD45+) (n=6–10/group (female and male). (D) YUMMER1.7 melanoma growth in 11–12 week old B6 mice (n=8/group (male), representative of 2 independent experiments including females). (E and F) 10 week old B6 mice or OT-I mice were implanted with EG.7-OVA lymphoma, and the tumor growth was monitored. Tumor score in B6 mice (n=7 (female)) and OT-I mice (n=4–6/group (female)) (left) and tumor growth (right) (E). Representative picture of OT-I mice after 4 weeks of tumor implantation (F). (G) E.G7-OVA tumor was implanted to 8 week old wild-type mice, and OT-I CD8 T cell were sorted from 8 week old OT-I mice and adoptively transferred to the tumor-bearing mice. Experimental scheme with OT-I transfer and activation (top) and E.G7-OVA growth (bottom). Data are represented as mean ± SEM. 2-way ANOVA (A, C, D, E (right), G), Log-rank Mantel-Cox test (B and E (left)), *p<0.05, **p<0.01, ***p<0.001 vs Control group.

