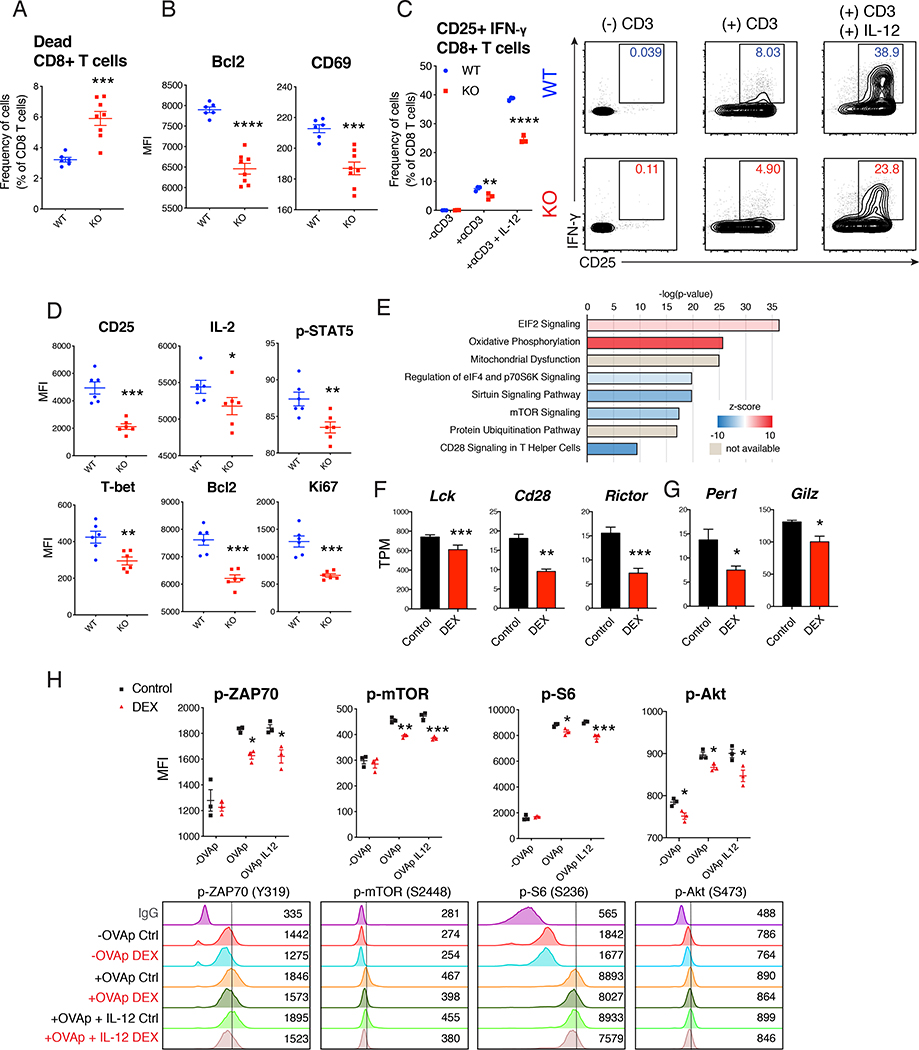
Figure 5. Reduction of GR signaling led to insufficient CD8 T cell response via reduction in survival and activation signaling.
(A and B) Footpads of 13 week old WT (Nr3c1fl/fl) mice and KO (CD4-Cre Nr3c1fl/fl) mice were immunized and analyzed (described in Figure 1B). Flow cytometric analysis of dead CD8 T cells in LNs (n=6–8/group (female and male)) (A), and the expression of Bcl2 and CD69 in CD8 T cell (n=6–8/group (female and male)) (B). (C and D) Wild-type BMDC and naïve CD8 T cells from 14 week old WT and KO mice were co-cultured in the presence or absence of anti-CD3ε antibody and IL-12. Flow cytometric analysis of CD25+ IFN-γ+ CD8 T cells (n=3/group (female), representative of 3 independent experiments including males) (C). Flow cytometric analysis of expression of proteins in CD8 T cells after activation with anti-CD3ε antibody (n=6/group (female), representative of 2 independent experiments) (D). (E-G) CD8 T cells were sorted (single cells/live/CD45+/CD3ε+/CD8α+) from LNs of 12 week old male B6 mice after 5 days of footpad immunization. mRNA from CD8 T cells was isolated and analyzed with RNA-seq. Differentially-regulated top canonical pathways with IPA analysis (E). Representative transcripts per millions (TPM) (n=3/group) (F and G). (H) Wild-type BMDC and naïve OT-I cells sorted from 16 week old OT-I mice were co-cultured as described in Figure 1G. Flow cytometric analysis after 3–6 hours of SIINFEKL (OVAp) treatment with or without IL-12 (n=3/group (male), representative of 2 independent experiments including females). Data are represented as mean ± SEM. 2-Way ANOVA (C and H), Student’s t-test (rest), *p<0.05, **p<0.01, ***p<0.001 vs Control or wild-type (WT) group.

