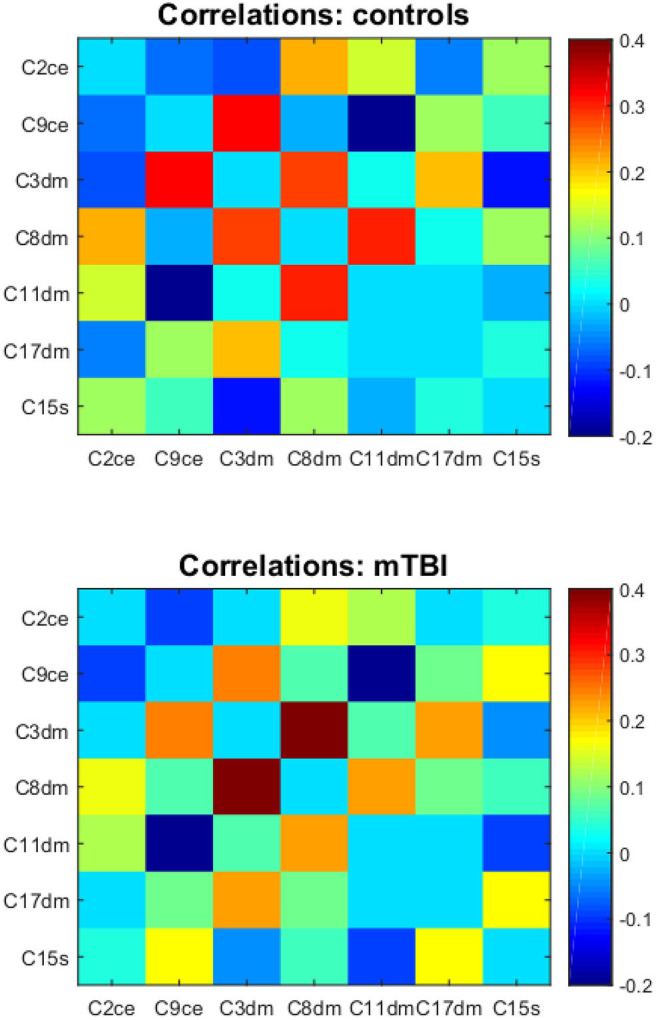
Figure 3.

The component correlation analysis results in the Mask(control) space. Top and bottom are the mean functional connectivity correlation matrices for controls and mTBI subjects, respectively. C2ce, C9ce—the central executive network; C3dm, C8dm, C11dm, C17dm—the default mode network; C15s—the salience network.
