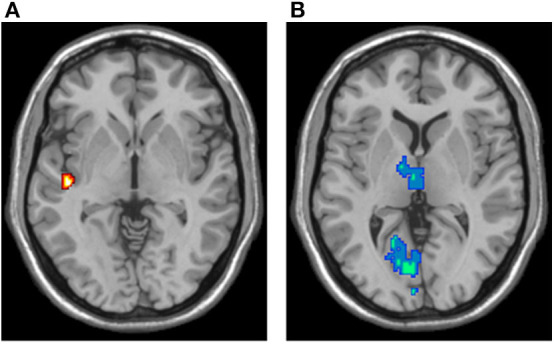
Figure 6.

ReHo analysis results, overlaid in the MNI brain. (A) Voxels demonstrating significant ReHo increases in the mTBI group (two-sample t-test; p-value < 0.05, corrected). (B) Voxels demonstrating significant ReHo decreases in the mTBI group (two-sample t-test; p-value < 0.05, corrected).
