Figure 5.
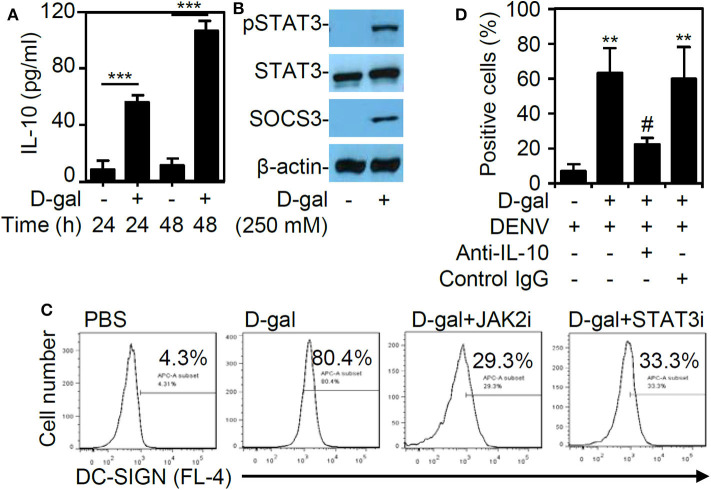
D-galactose treatment induces IL-10 production and activation followed by JAK2-STAT3-regulated DC-SIGN expression. (A) ELISA data showing the IL-10 expression in the THP-1 cells treated with D-galactose (D-gal; 250 mM). The quantitative data are shown as the mean ± SD of three independent experiments. ***p < 0.001. (B) Representative Western blot analysis of pSTAT3 (Tyr705), STAT3, and SOCS3 protein expression 48 h poststimulation. β-actin was used as an internal control. (C) Cotreatment with or without the JAK2 inhibitor AG490 (JAK2i; 100 μM) and the STAT3 inhibitor niclosamide (SATA3i; 0.1 μM), immunostaining followed by flow cytometric analysis showing the expression of DC-SIGN in the D-gal-stimulated THP-1 cells. A representative histogram and the percentage of positive cells are shown. (D) Flow cytometry measured the infectivity of fluorescent Alexa-594-labeled DENV2 (at a multiplicity of infection of 1) 2 h post-infection in D-galactose (D-gal; 250 mM)-treated THP-1 cells in the presence and absence of neutralizing anti-IL-10 and control IgG (5 μg/ml). **p < 0.01 compared to the DENV-infected cells. #p < 0.05, compared to the DENV-infected senescent cells.

