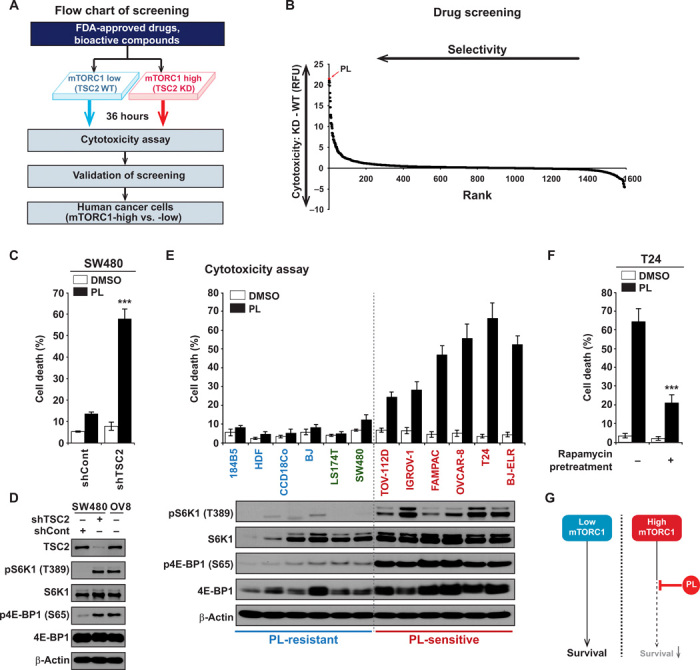
Fig. 1. High-throughput screening for compounds with synthetic lethality against mTORC1-high cancer cells.

(A) Scheme of screening. Chemical library containing 1576 FDA-approved drugs and bioactive compounds were treated to SW480 shControl (WT) and SW480 shTSC2 (KD) cells. shControl or shTSC2 viral vectors were infected to SW480 cells and cells were selected with puromycin. Capability to induce cell death was measured to rule out cytostatic compounds. Hits were validated and further confirmed in the cells. (B) Cytotoxicity in WT and KD cells were measured after compounds were treated for 36 hours in 96-well plates in duplicate. Fluorescence-based cytotoxicity assay (CellTox Green) was used and to determine the selectivity, and the level of cell death induced in WT cells was subtracted from the level of cell death induced in KD cells. Higher values indicate higher selective cytotoxicity against mTORC1-high cells. RFU, relative fluorescence unit. (C) Increase in mTORC1 activity enhances PL-mediated cell death. SW480 shControl and SW480 shTSC2 cells were treated with PL (10 μM) for 48 hours, and cell viability was measured. (D) Analysis of mTORC1 signaling in SW480 shControl and SW480 shTSC2 cells. OVCAR-8 (OV8) cells were used as a control for comparison. (E) Correlation between PL-induced cell death and mTORC1 levels. Cell death was measured in various normal and cancer cells after 48 hours of PL (10 μM) treatment. Normal or nonmalignant immortalized cells, 184B5, human dermal fibroblast (HDF), CCD-18Co, and BJ-hTERT (BJ); low mTORC1 cancer cells, LS174T and SW480; high mTORC1 cancer cells, TOV-112D, IGROV-1, FAMPAC, OVCAR-8, T24, and BJ-ELR. Immunoblot results show increased mTORC1 activity in PL-sensitive cells. (F) Inhibition of mTORC1 activity reduces PL-mediated cell death. Dimethyl sulfoxide (DMSO) or 100 nM rapamycin was pretreated for 16 hours, and then PL 10 μM was treated to T24 cells. (G) PL selectively kills cancer cells with high mTORC1 activity. All data are presented as means ± SD. Significant differences were calculated by one-way analysis of variance (ANOVA) compared with shControl group or rapamycin-untreated group (***P < 0.001).
