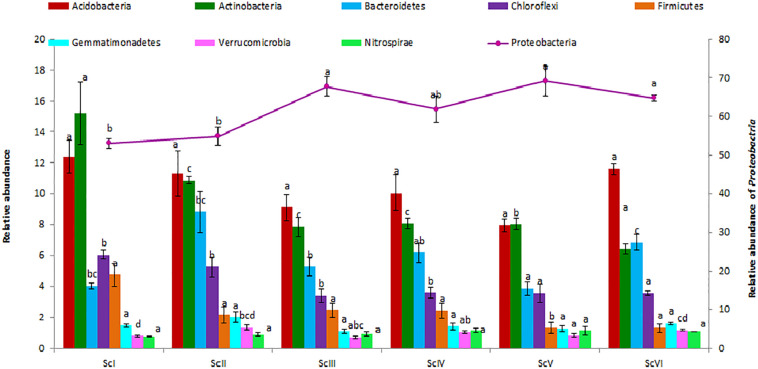
FIGURE 3.
Distribution of different dominating phyla (> 1%) in different agriculture management scenarios. Where; ScI, conventional rice-wheat system; ScII, partial CA based rice-wheat-mungbean system; ScIII, partial CSA based rice-wheat-mungbean system; ScIV, partial CSA based maize-wheat-mungbean system; ScV, full CSA based rice-wheat-mungbean system with sub surface drip irrigation; ScVI, full CSA based maize-wheat-mungbean system with sub surface drip irrigation. The same letters within each column are not statistically different between scenarios for each phylum (P ≤ 0.05, Duncan’s multiple range test) and values are the average of three replicates (n = 3); means ± standard error SE.

