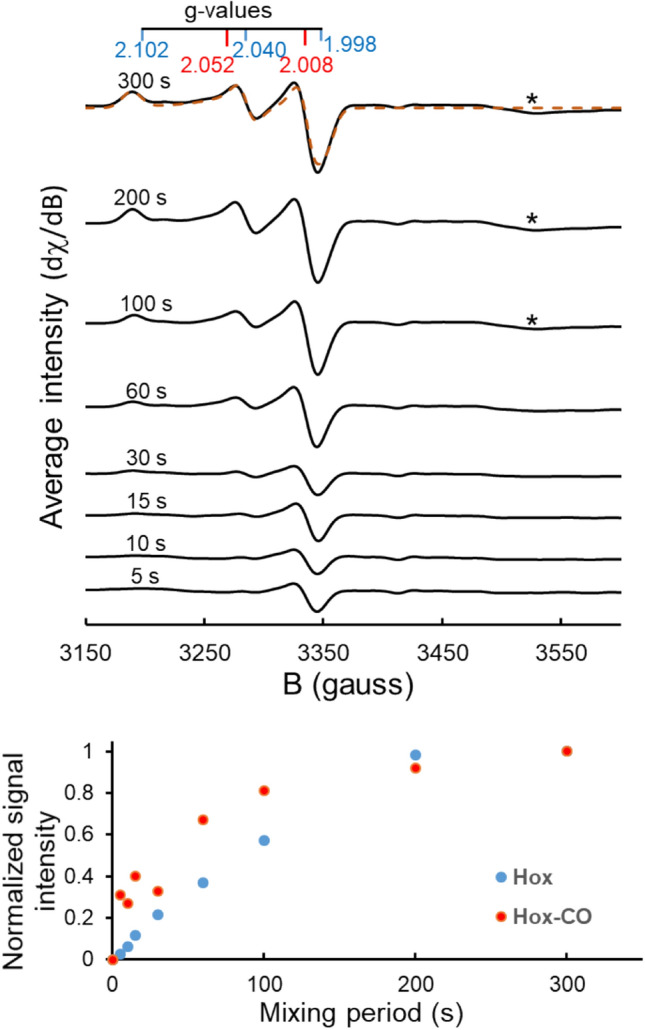
Fig. 2.

H-cluster assembly monitored by EPR spectroscopy. Top panel: spectra recorded for mixtures of apo-HydA1 and [2Fe]adt incubated for increasing periods as indicated. Each spectrum represents the average of three replicates (spectra are vertically shifted for clarity; individual spectra are shown in Fig. S1). The g values for Hox (blue) and Hox-CO (red) are indicated (derived from spectral simulations, see Fig. S1; and a simulation of the final 300 s spectrum is overlaid, orange dashed line); a feature appearing at g = 1.91 (asterisks) is attributable to the formation of a reduced iron–sulfur cluster (see text) [47]. Bottom panel: relative signal intensities (symbols) of the Hox and Hox-CO states plotted vs. the incubation period (t = 300 s corresponding to 100% amplitude). The Hox and Hox-CO intensities were calculated through fitting a linear combination of their respective simulated spectra to the averaged experimental spectra shown in the top panel
