Fig. 3.
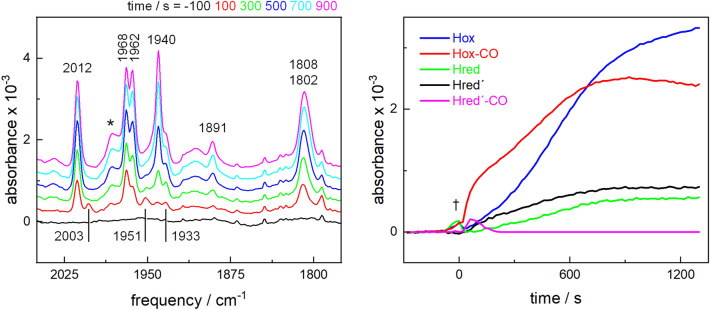
H-cluster assembly monitored by in situ ATR FTIR spectroscopy. [2Fe]adt was added to a film of apo-HydA1 at around t = 0 s. Left panel: representative series of spectra for increasing incubation periods (in 100–200 s steps) showing H-cluster-specific bands in the CO vibrations region (marker bands: Hox-CO, 2012 cm−1; Hred′-CO, 2003 cm−1; Hox, 1940 cm−1; Hred′, 1933 cm−1; Hred, 1891 cm−1). *Background signal due to transient protein concentration changes upon injection of [2Fe]adt (see Fig. S2). Right panel: changes of the intensities of marker IR bands of H-cluster states for increasing time periods after [2Fe]adt addition. Band intensities were determined from the spectra in the left panel. †Transient contribution due to protein concentration changes upon injection of [2Fe]adt (see Fig. S2), attributed to a vibrational band of water vapor

