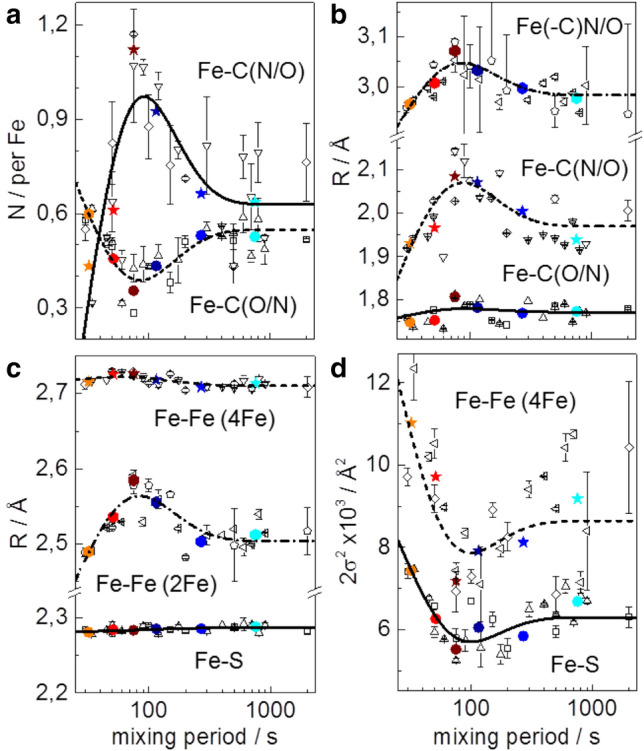
Fig. 6.

EXAFS simulation parameters. N, coordination number (a); R, interatomic distance (b and c); 2σ2, Debye–Waller factor (d) of indicated interactions; 4Fe and 2Fe denote parameters attributable to the [4Fe–4S] or diiron sites. Data correspond to spectra of apo-HydA1/[2Fe]adt mixtures in Fig. S6 and Fig. 4 (open black symbols denote two series of samples; error bars represent variations for four different EXAFS fit approaches, Table S1; colored solid symbols denote averaged data for mean mixing periods, Fig. 5). The lines show simulations (Eqs. 1 and S1) with time constants as in Fig. 4 (5 s, 20 s, 180 s)
