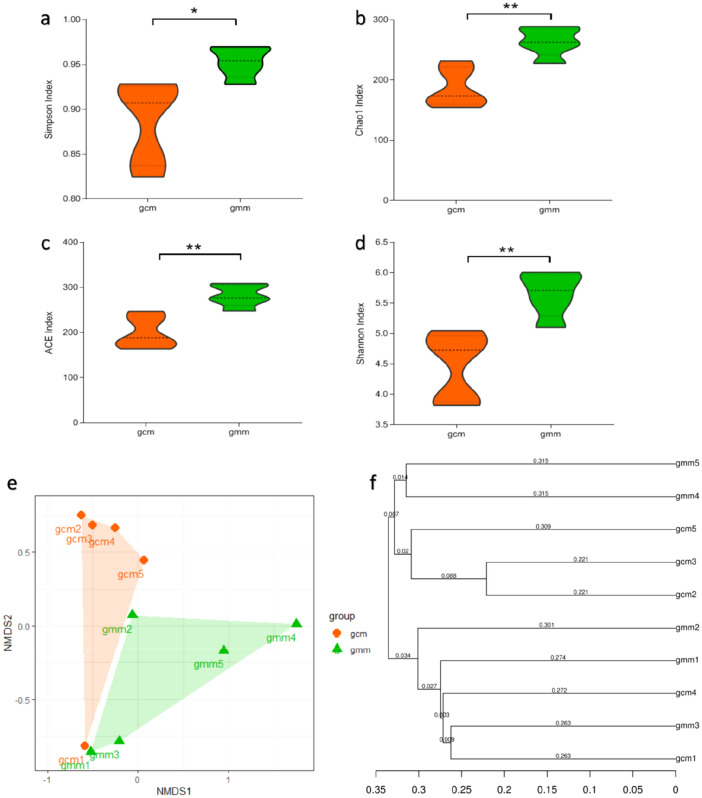
Fig. 2.
Diversity of the microbial community in the intestinal mucosa of the mice with diarrhoea and repeated stress (gcm) and the mice given distilled water (gmm). Alpha diversity was evaluated based on the Simpson (a), Chao1 (b), ACE (c), and Shannon (d) indices of the OTU levels. Principal coordinate analysis of beta diversity was based on the weighted UniFrac (e) and UPGMA clustering (f) analyses of weighted UniFrac distance matrix. Each point represents a sample. The closer the points are, the more similar the structures of the communities. gcm control group, gmm model group. *P < 0.05; **P < 0.01

