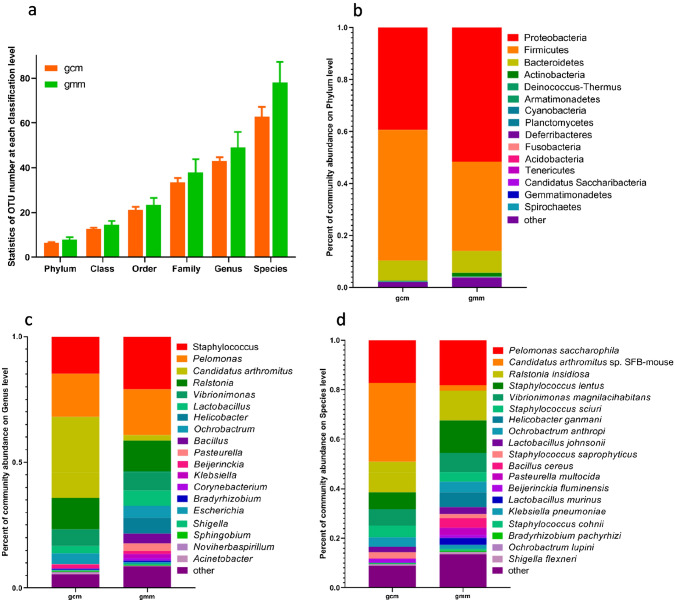
Fig. 3.
Composition profiles of microbiota colonized in intestinal mucosa in the mice with diarrhoea and repeated stress (gcm) and the mice given distilled water (gmm). a Mean OTUs at each classification level; Phylum-level bacteria (b), Genus-level bacteria (c), and Species-level bacteria (d) were significantly different between the 2 groups; data were showed as relative abundance (%) of top 20 most abundant in each group. The abscissa is arranged according to group. The ordinate shows the relative abundance. The same colour represents the same classification unit, and longer bars indicate higher relative abundances of units

