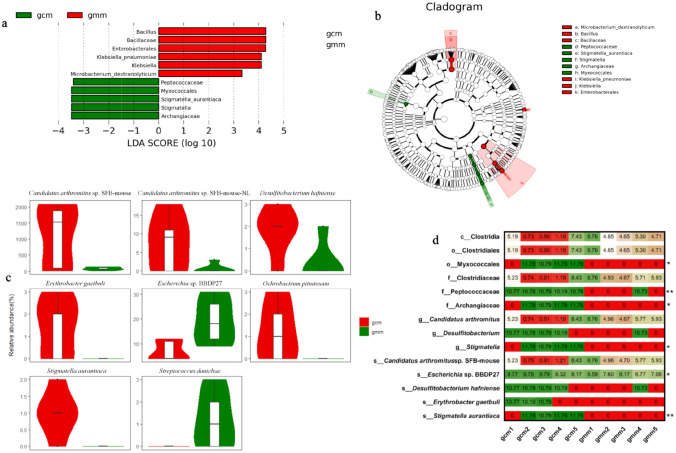
Fig. 5.
Key biomarkers for mice with diarrhoea and repeated stress. a Cladogram generated from the LEfSe analysis indicating the phylogenetic distribution from phylum to species of the microbiota. Diagram of taxonomic units with significant differences between groups. The ordinate represents the taxa with significant differences, and the abscissa represents the LDA scores visualized as bars. The bars are ordered by score to describe the differences in each sample. The longer the bar is, the more significant the difference. b Diagram of intergroup difference in taxonomic units based on the classification tree. Histogram of LDA scores to identify differentially abundant bacterial species (LDA score ≥ 2, P < 0.05). The cladogram shows all the hierarchical relationships among the taxonomic units from phylum to species. The node sizes correspond to the average relative abundances of the taxa. The colour indicates a significant difference in the taxa and high abundance in the sample; green colour represents gcm group, red colour represents gmm group. The letters identify taxa had obvious differences. c Abundance distribution between groups at the species level. The 8 absolute abundance difference at the level of species was test by the statistical algorithm of metastats (P < 0.05). d Relative abundance heat map. Red color means low relative abundance; green color means high relative abundance. *P < 0.05; **P < 0.01

