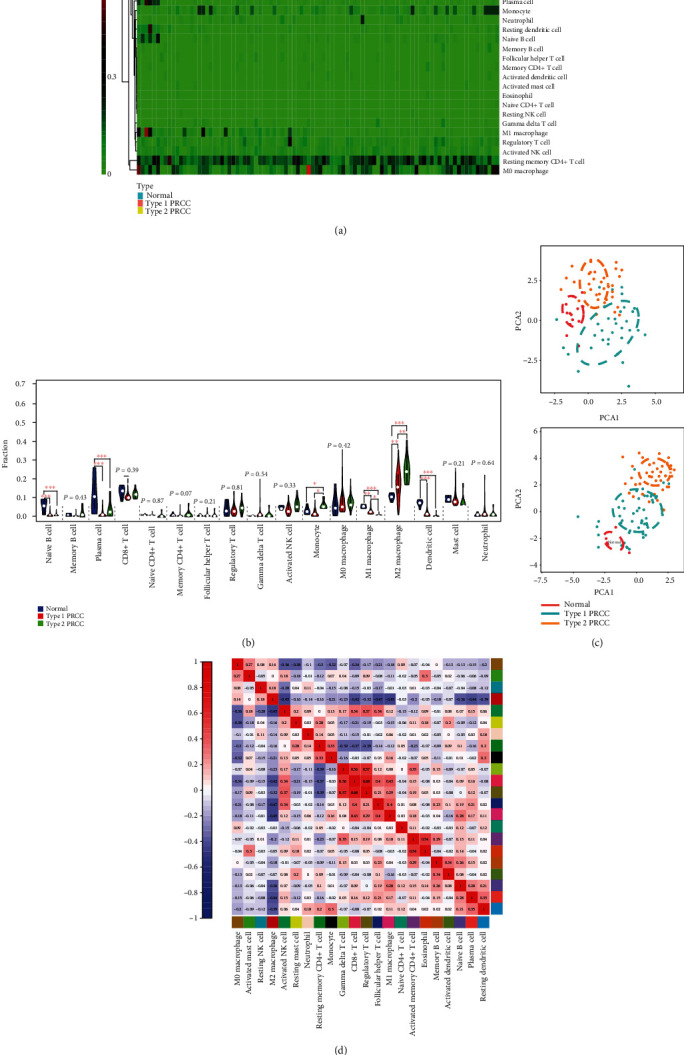
Figure 3.

Profiles of infiltrating immune cells in normal and PRCC tissues. (a) Heat map based on proportions of 22 immune cell types in normal, type 1, and type 2 PRCC tissues. (b) Violin plot showing differences in the expression of 22 immune cell types in normal (blue), type 1 (red), and type 2 (green) PRCC groups. (c) PCA analyses indicating group-biased clustering of immune cells from 76 GEO cases and 95 TCGA cases. (d) Correlation analysis based on 22 immune cell subpopulations. ∗P < 0.05, ∗∗P < 0.01, and ∗∗∗P < 0.001.
