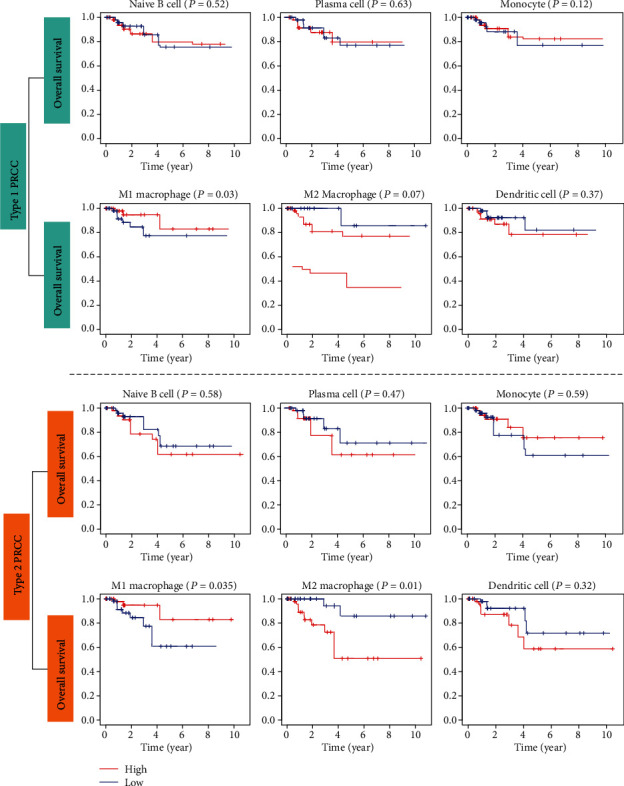
Figure 4.

Kaplan–Meier survival curves obtained to investigate the impacts of key immune cell types on overall survival in type 1 and type 2 PRCC patients. A P value < 0.05 was considered to indicate a significant difference based on the log-rank test.
