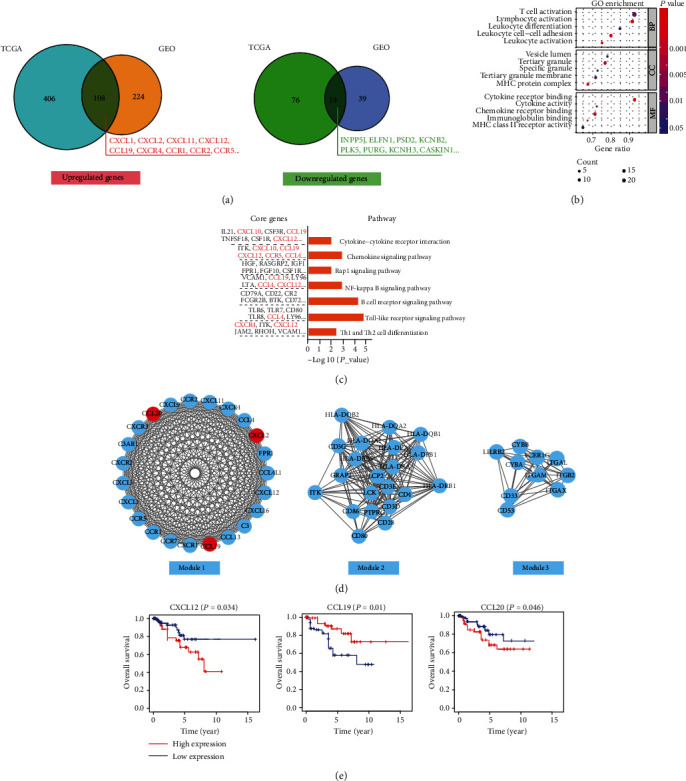
Figure 6.

Functional enrichment analysis and selection of key modules for DEGs in type 2 PRCC tissues. (a) Overlapping genes identified in TCGA and GEO databases. Significant (b) GO terms and (c) KEGG pathways for the upregulated genes identified in the high immune score group of type 2 PRCC. (d) Three meaningful modules in the PPI network. (e) Kaplan–Meier curves were prepared according to the high and low expression levels of core genes in type 2 PRCC.
