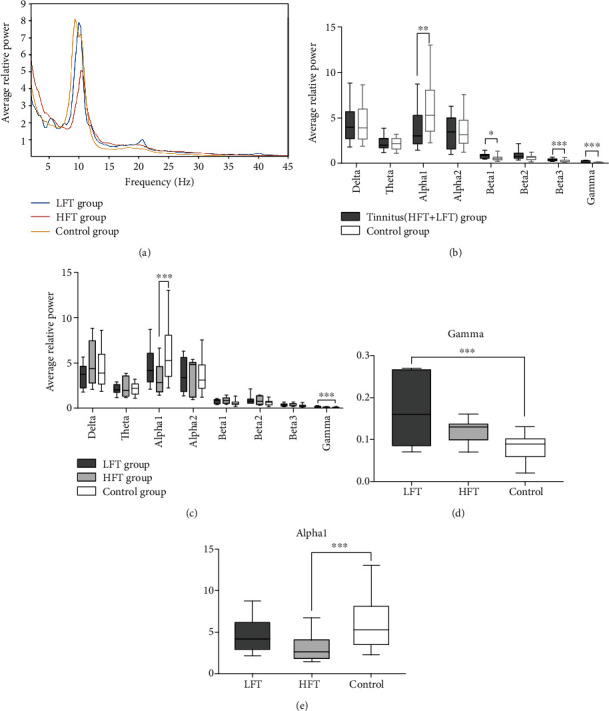
Figure 1.

EEG results of the tinnitus and control groups: (a) the distribution of averaged brain activities along the band frequency in each group; (b) comparisons of average EEG power at eight frequency bands between the total tinnitus group and control groups; (c) intergroup comparisons of averaged brain activities; (d, e) the magnified view at gamma (30.5–44 Hz) and alpha1 (8–10 Hz) frequency bands in (c). ∗p < 0.05, ∗∗p < 0.01, and ∗∗∗p < 0.001 against the control group.
