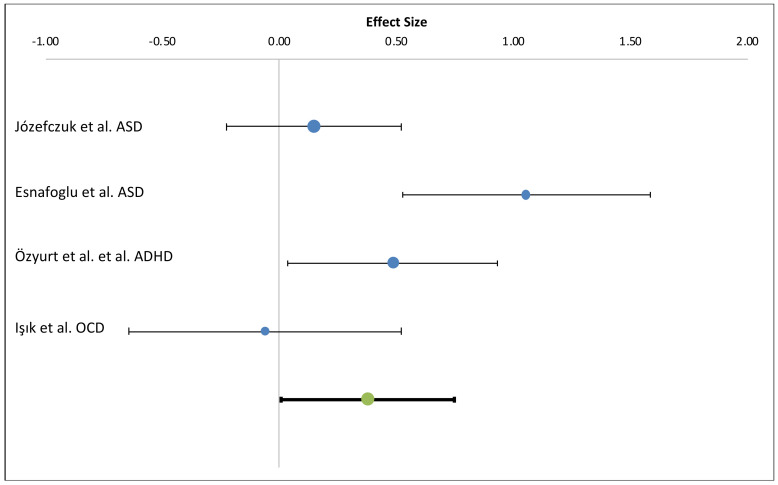
Figure 2.
Forest plot showing the individual mean differences among cases and controls for each of the four studies and the combined estimate from a fixed-effect model (bottom, p = 0.001). The Effect estimates are presented as Cohen’s d with positive effect size indicating higher zonulin levels among cases compared to controls.

