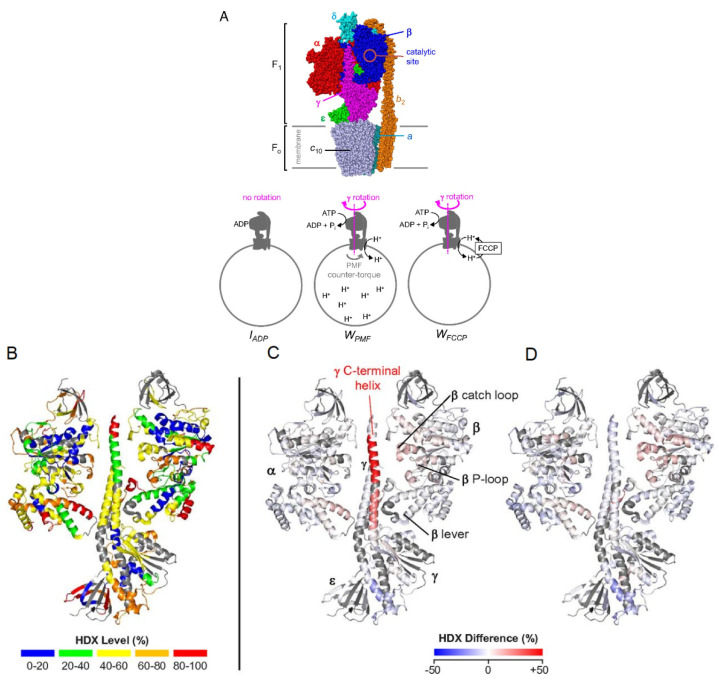
Figure 9.
(A) Subunit architecture of FOF1 ATP synthase from E. coli. The bottom panel depicts membrane vesicle-bound FOF1 under different experimental conditions. (B) HDX levels of IADP for an HDX period of 45 min. (C) Deuteration difference map of WPMF vs. IADP. (D) Deuteration difference map of WFCCP vs. IADP. Regions that were not covered are shown in dark gray. Colors represent deuteration percentages or HDX difference (%) as indicated in the legends. Reproduced with permission from the National Academy of Sciences (© 2016).

