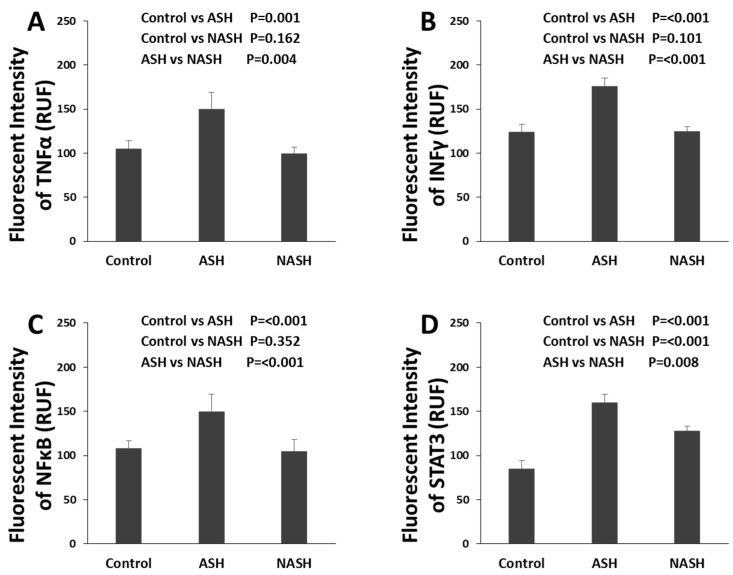
Figure 5.
Different changes of molecules in ASH and NASH specimens. (A) Level of expression of TNFα protein up-regulated in ASH but not in NASH, compared with normal controls (both p < 0.001). Expression is measured as fluorescence intensity and displayed as mean +/− standard deviation in this Figure 5A–D. (B) Level of expression of INFγ protein up-regulated in ASH but not in NASH compared with normal controls (both p < 0.001). (C) Level of expression of NFκB protein up-regulated in ASH but not in NASH compared with normal controls (both p < 0.001). (D) Level of expression of STAT3 protein up-regulated in ASH and NASH compared with normal controls (both p < 0.001), but also significantly higher in ASH compared with NASH (p = 0.008) [9,21,23].

