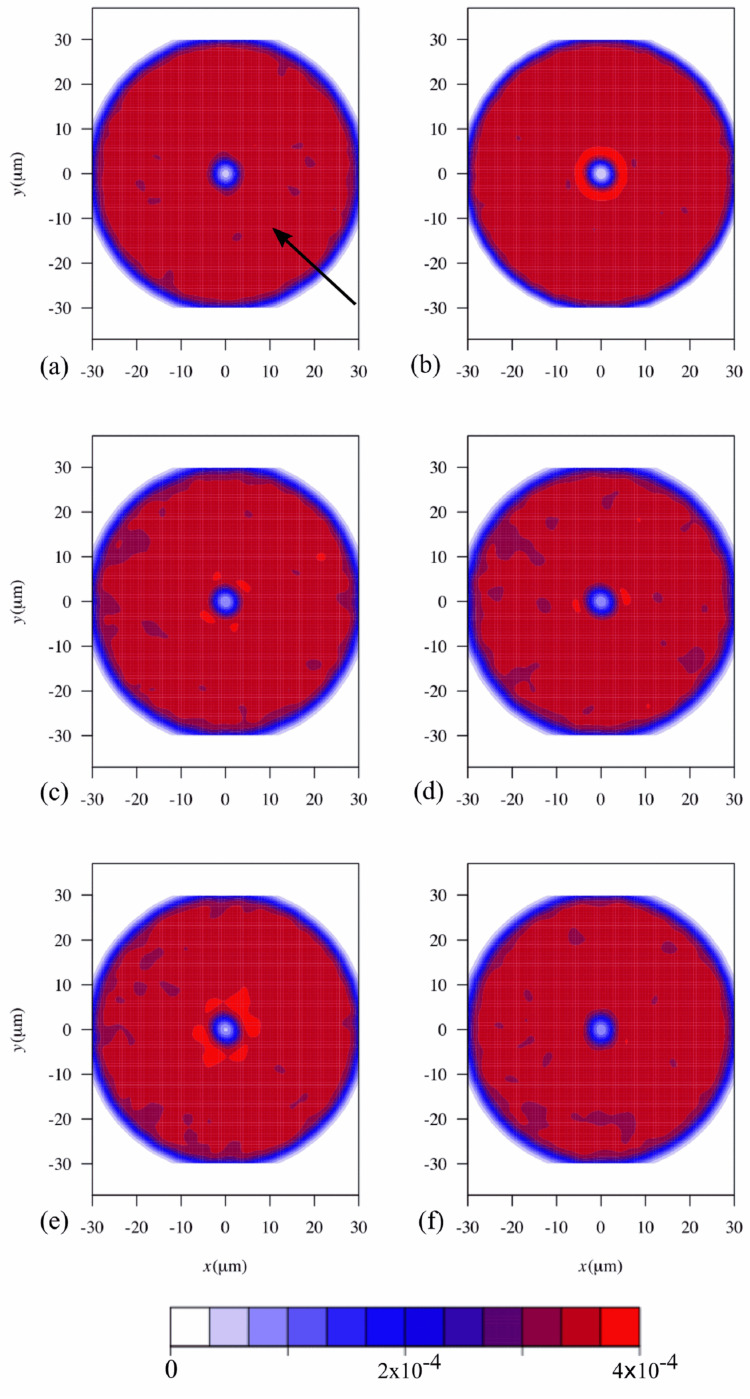
Figure 4.
2D histograms representing the probability density function of the presence of a cell around a given cell (reference cell is in the center). Results for different flow rates are shown: (a) 1 mL/s, (b) 2 mL/s, (c) 4 mL/s (d) 6 mL/s, (e) 8 mL/s, and (f) 10 mL/s corresponding to shear rates of 7.5/s, 15.0/s, 33.7/s, 51.6/s, 80.3/s, and 100.8/s, respectively, in a PPFC. The number of independent cells measured for each flow rate was (a) 1.53 × 10⁶ ± 1.84 × 10⁵ cells/cm2; (b) 1.49 × 10⁶ ± 6.14 × 10⁴ cells/cm2; (c) 1.13 × 10⁶ ± 8.87 × 10⁴ cells/cm2; (d) 1.29 × 10⁶ ± 9.84 × 10⁴ cells/cm2; (e) 9.41 × 10⁵ ± 8.25 × 10⁴ cells/cm2 and (f) 1.07 × 10⁶ ± 1.37 × 10⁵ cells/cm2. The direction of the flow in all histograms is depicted by an arrow located on panel (a).

