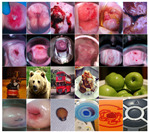
Figure 2.

Examples of cervix images used in this study, showing quality variability. 1st row: MobileODT dataset; 2nd row: Kaggle dataset; 3rd row: COCO dataset; 4th row: SEVIA dataset (only the first two images are cervix images, the rest images in this row are non-cervix image samples in this dataset).
