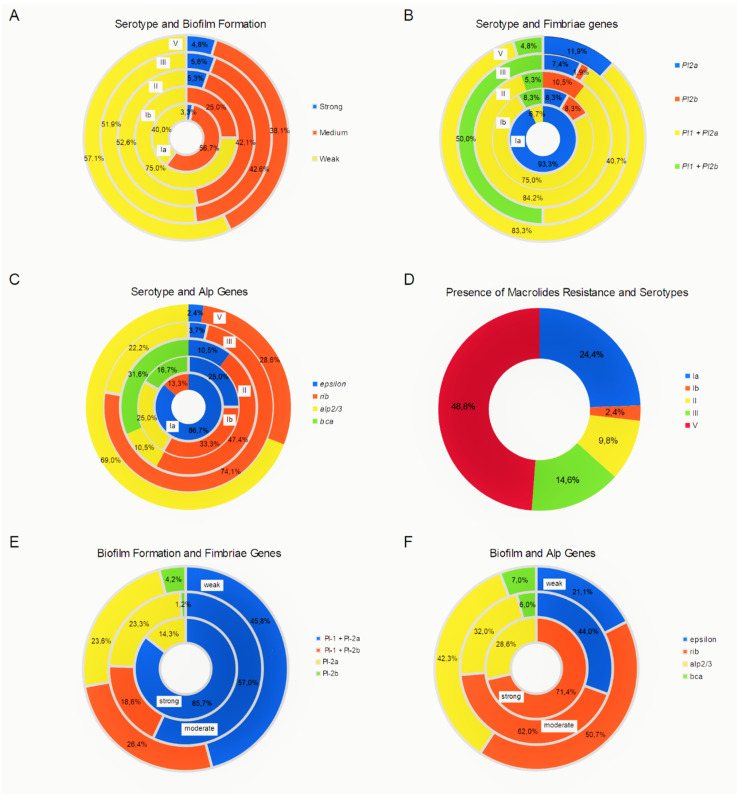
Figure 2.
Correlation analyses performed based on the obtained results. (A) The distribution of the strong (indicated in naval blue), moderate (red), and weak (yellow) biofilm producers in the most frequently observed serotypes (shown in the circles, placed with the Ia close to the center, through Ib, II, III, and V the most distally, respectively) was evaluated. No statistically significant difference in the incidence of the serotypes was found (p > 0.05). (B) The occurrence of genes encoding various types of fimbriae (marked with naval blue, red, yellow and green) among the most frequently isolated serotypes, Ia, Ib, II, III and V, VI (presented in circles) was analyzed. (C) The occurrence of genes coding the tested proteins from the Alp family (indicated by colors) was analyzed in the strains representing individual serotypes (shown in the circles). Statistically significant differences were found in the occurrence of epsilon (p < 2.2e-16)* (naval blue), rib (p = 8.802e-07)* (red), alp 2/3 (p = 1.851e-09)*(yellow) and bca (p = 1.573e-07)* (green) genes among individual serotypes. (D) Analyzing the participation of individual serotypes (color-coded) among erythromycin-resistant strains (presented in a circle), it was observed that almost half of these strains (n = 28) belonged to serotype V (brown), followed by serotypes Ia (naval blue), III (green), and II (yellow). The observed differences in prevalence were statistically significant (p = 3.483e-05)*. (E) The presence of genes encoding different types of fimbriae (indicated by colors) was compared among strains differing in the ability to form biofilms (shown in the circles). The differences found were not statistically significant. (F) The presence of genes encoding surface proteins (color coded) in the strains differing in the ability to form biofilm structure (shown in the circles) was compared. In all analyzed groups dominated isolates with the rib gene (red). The observed differences were not statistically significant. * Statistically significant.

