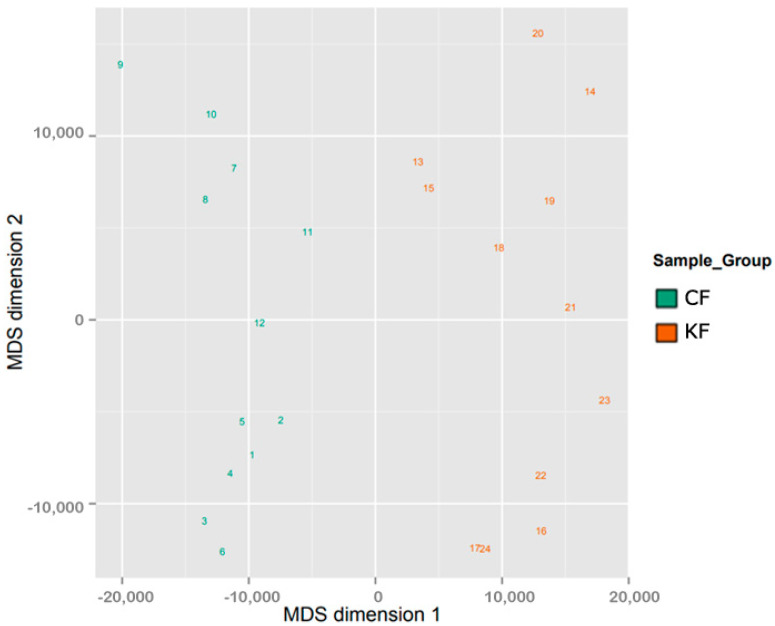
Figure 2.
Two Multidimensional scaling (MDS) of the sample groups. The scatter plots show the coordinates of the control fibroblasts (CF) and keloid fibroblasts (KF) samples after performing Kruskal’s multi-dimensional scaling based on the matrix of the average methylation levels and Manhattan distance. The plot of 24 samples (1–12 CF and 13–24 KF) shows that samples cluster according to methylation level, as expected.

