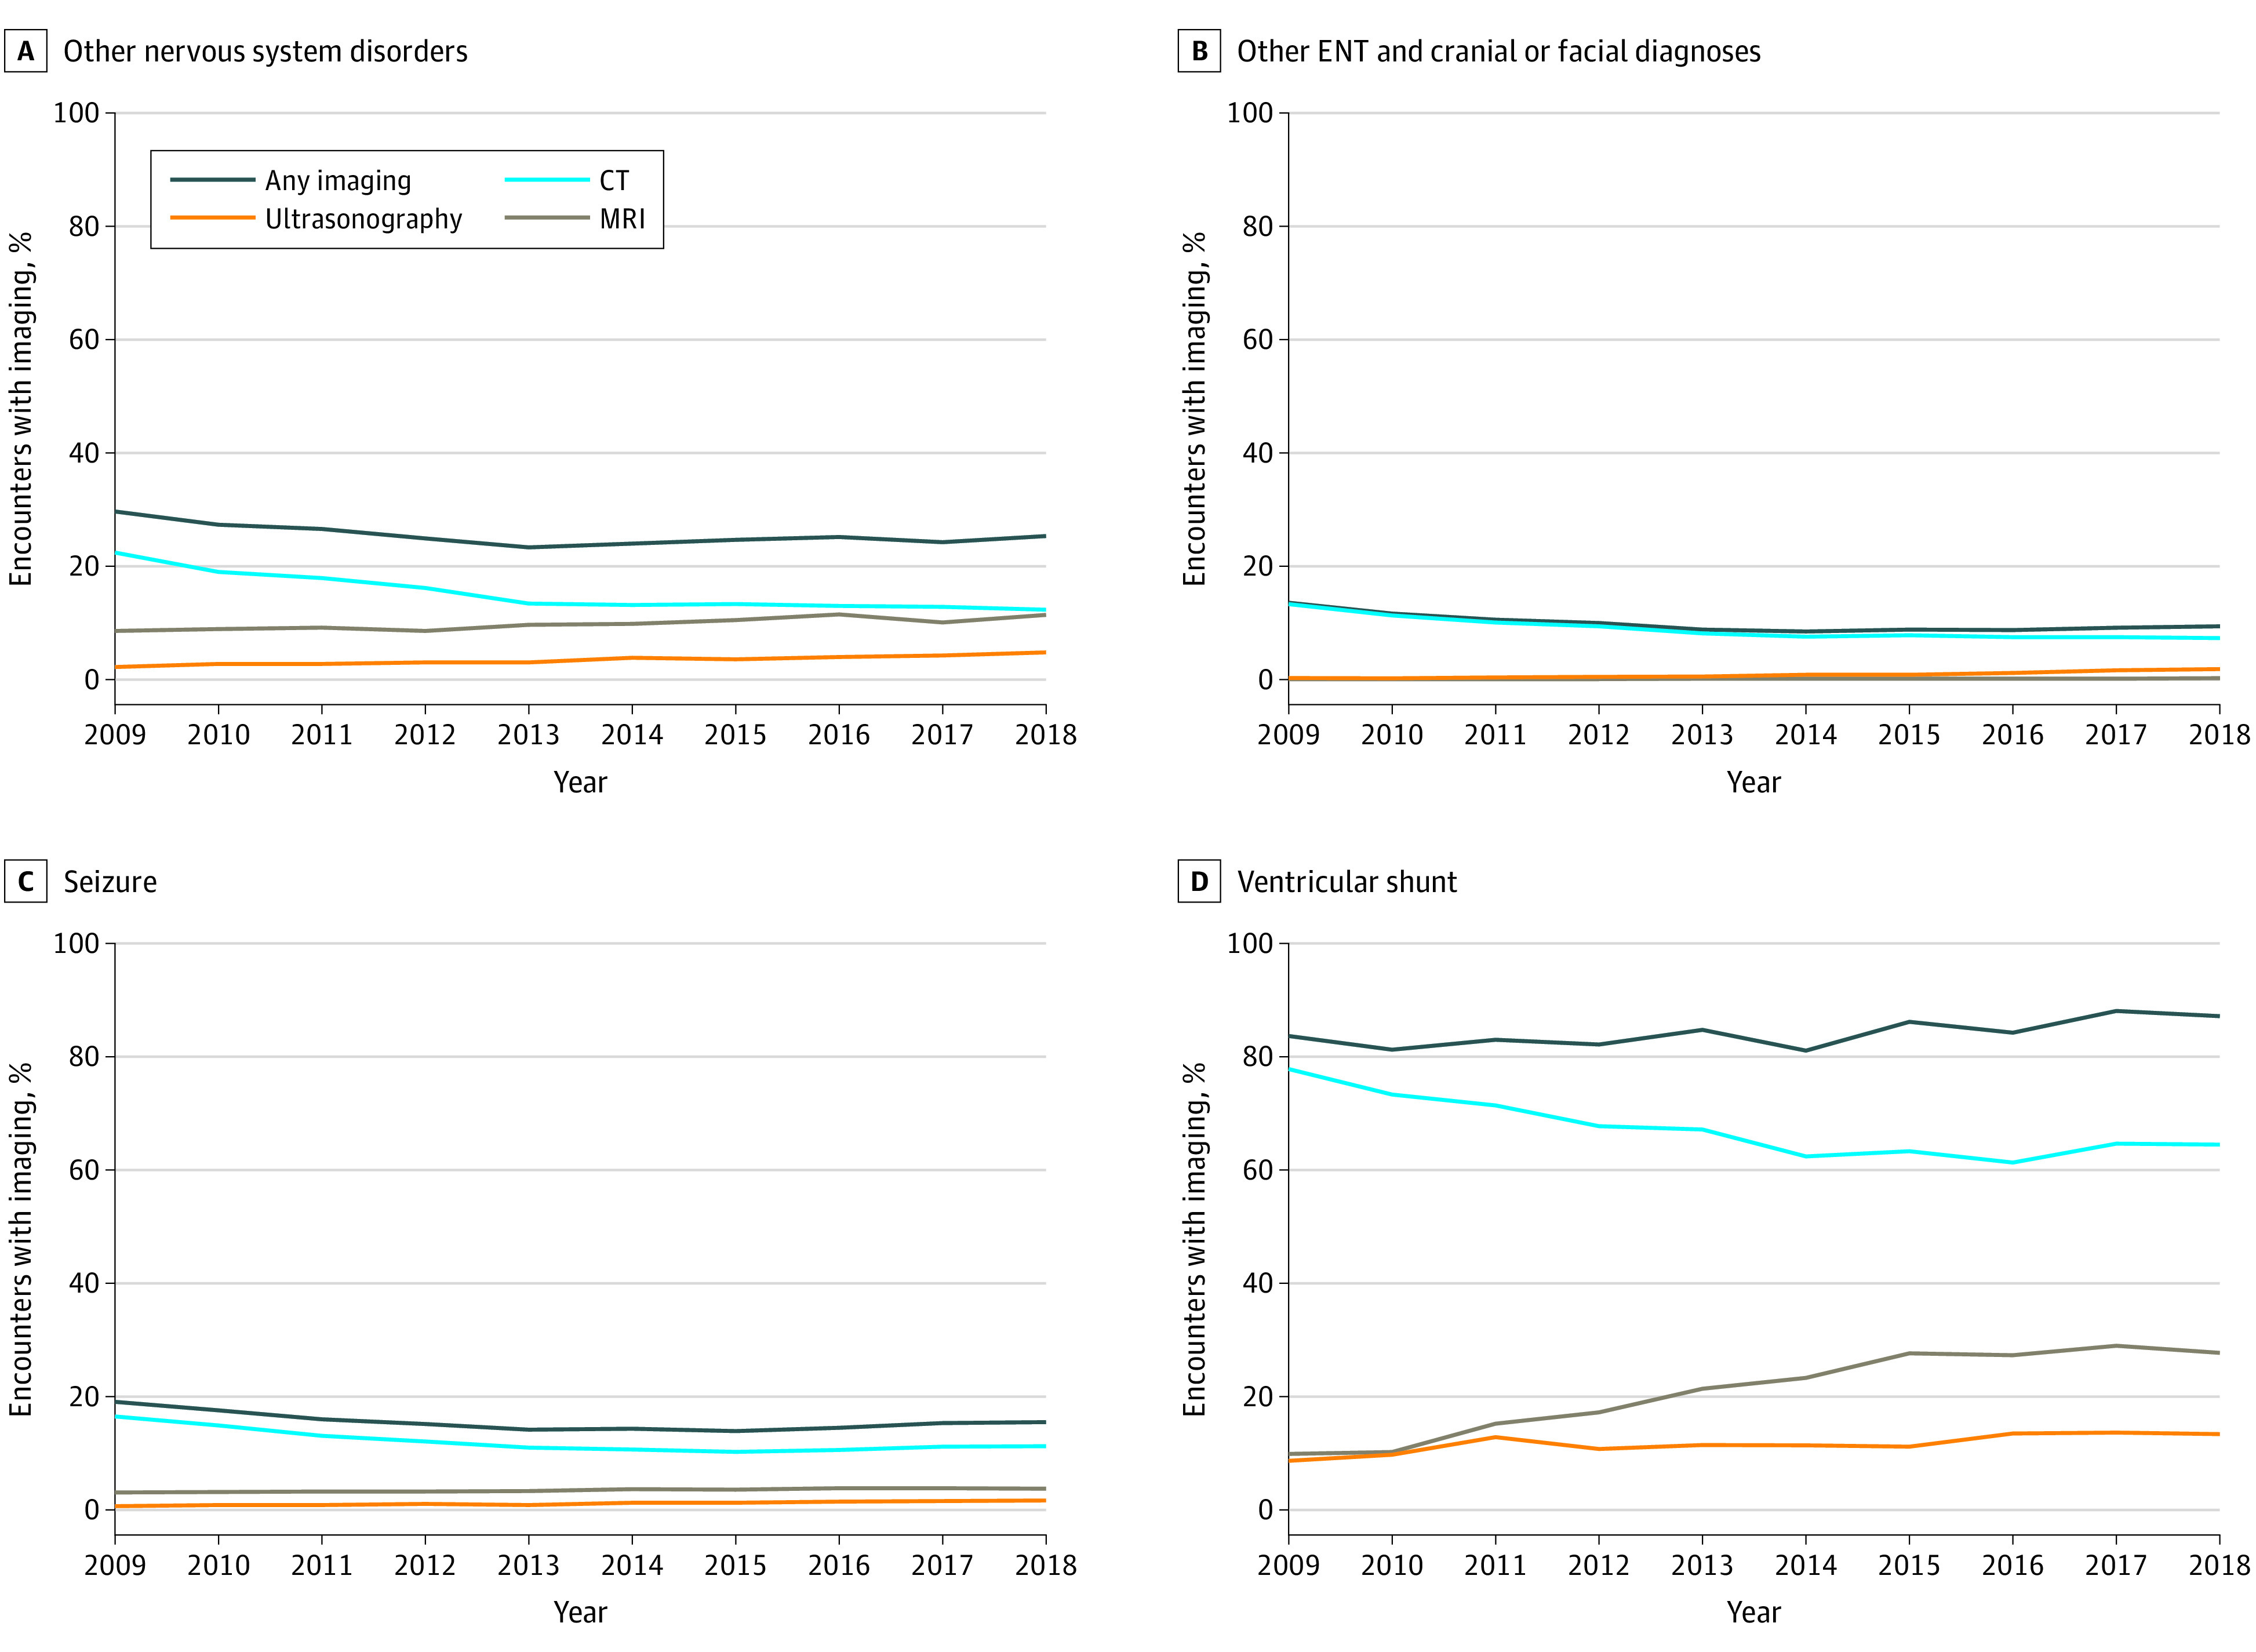
Figure 3. Trends Over Time in Advanced Imaging for the Remaining 4 All Patient-Refined Diagnosis Related Groups With the Largest Decreases in Computed Tomography (CT) Use, 2009-2018.

P < .001 for trend for all comparisons except for magnetic resonance imaging (MRI) seizure (P = .005), ultrasonographic ventricular shunt (P = .007), and any imaging ventricular shunt (P = .001). ENT indicates ear, nose, and throat.
