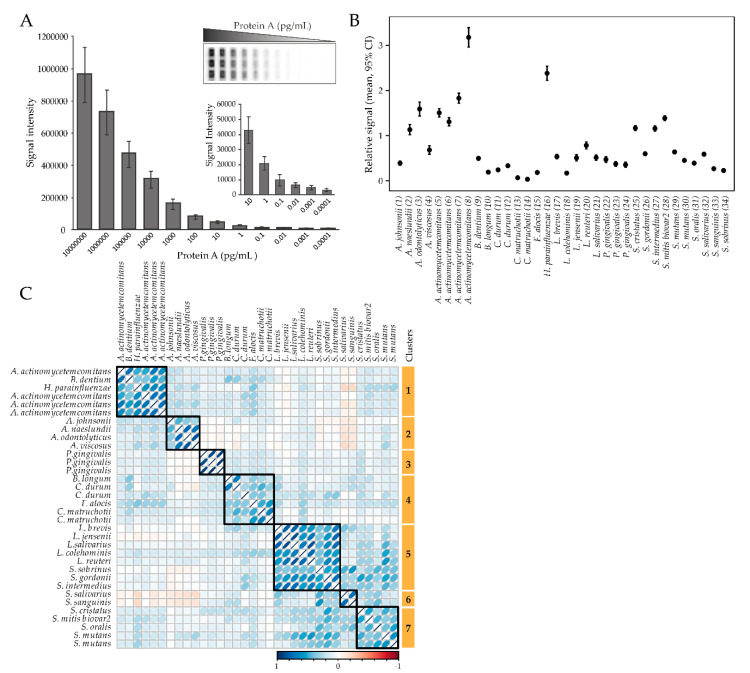
Figure 1.
Overall antibody responses to the test panel of oral bacteria. (A) Checkerboard sensitivity evaluation using Protein A revealed linear detection from 10−1 to 107 pg/mL. (B) Relative antibody response levels among the tested bacterial probes. Data are presented as mean and 95% CI. (C) Correlation-based clustering of plasma antibody levels for the tested oral bacteria panel.

