Figure 2.
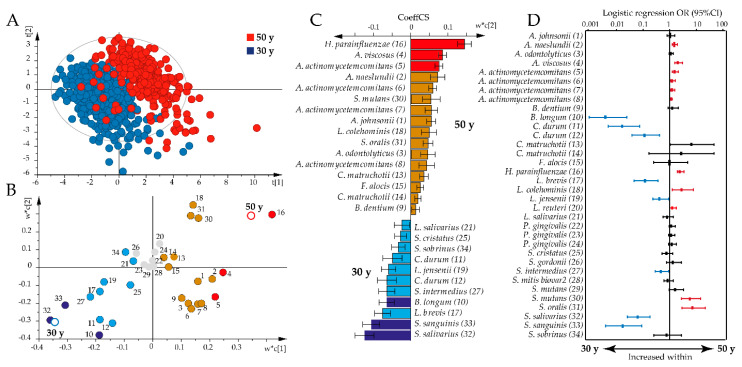
Age-dependent antibody responses to the oral bacteria test panel. Partial least square analyses with antibody responses as independent x-variables modeled against age as y were used to explore age associations with antibody profiles. (A) Partial least square (PLS) scatter plot (each symbol represents a participant) shows clustering of 30-year-olds versus 50-year-olds based on the concerted antibody profile. (B) PLS loading plot illustrating the association between each bacteria sample (colored dots, for numbers see Supplementary file Table S1) and age (open rings). Gray dots indicate non-significant x-variables. (C) Bar graph showing significant PLS correlation coefficients (CoeffCS) in the 50-year-old and 30-year-old groups. Red and dark blue colors indicate associations that are significant according to both the variable in projection score (B) and the PLS correlation coefficient (C), whereas orange and light blue colors indicate associations that are significant according to the PLS correlation coefficient only. (D) Odds ratios (ORs) with 95% confidence intervals (CIs) in the 50-year-old or 30-year-old age groups based on binary logistic regression with an antibody response to each of the 34 bacterial samples, including sex, smoking, and storage time as covariates. The red color indicates antibody responses that were significantly increased among the 50-year-olds and the blue color those that were increased among the 30-year-olds. Significance was considered for p-values < 0.05 with false discovery rate (FDR) after adjusting for multi-comparison using the Benjamini Hochberg correction.

