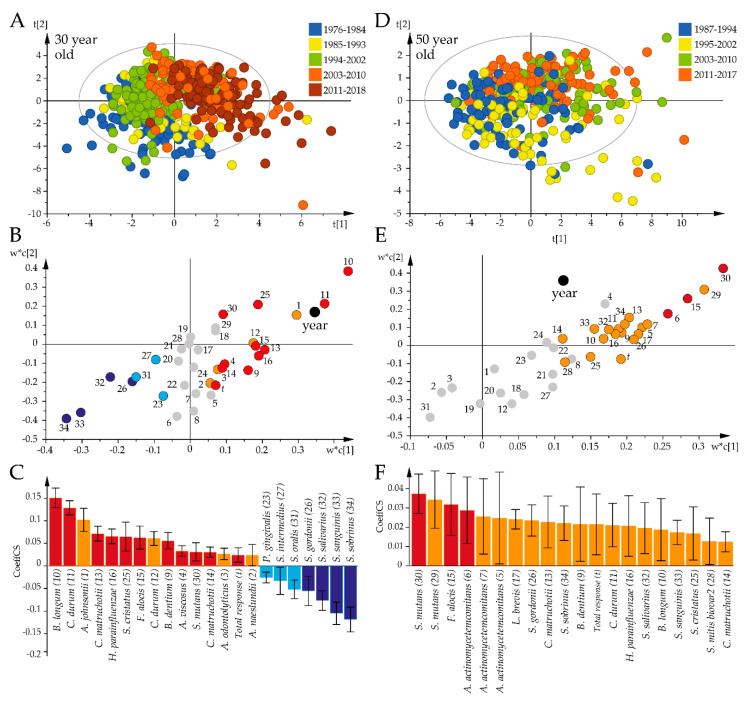
Figure 4.
Temporal trends in the global bacterial antibody response profiles for the 30-year-old and 50-year-old participants. Results from PLS modeling with antibody responses as independent x-variables and time periods as dependent variables are illustrated in a loading scatter plot (indicating subject distribution), loading plot (indicating sample distribution), and PLS correlation coefficient plot (indicating mean correlations with 95% CI). (A–C) The 30-year-olds. (D–F) The 50-year-olds. Red/orange bars indicate significantly increased and blue/light blue significantly decreased responses over time. Red and dark blue coloring indicate significant associations according to both the variable projection scores and the PLS correlation coefficients, whereas orange and light blue coloring indicate significance according to the PLS correlation coefficient only. Gray dots in (B) and (E) indicate non-significant x-variables.

