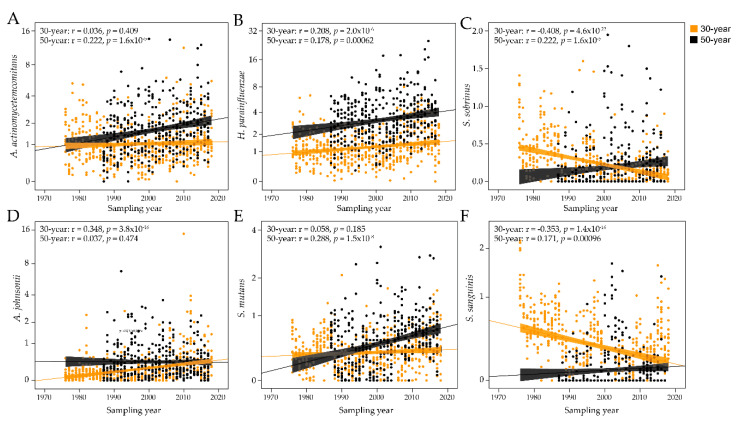
Figure 5.
Temporal trends in antibody responses to select bacterial species. Scatter plots of the antibody responses over time for the 30-year-old and 50-year-old groups for (A) Aggregatibacter actinomycetemcomitans, (B) Haemophilus parainfluenzae, (C) Streptococcus sobrinus, (D) Actinomyces johnsonii, (E) Streptococcus mutans, and (F) Streptococcus sanguinis. The dots represent individual subjects and the lines trends with 95% CI.

