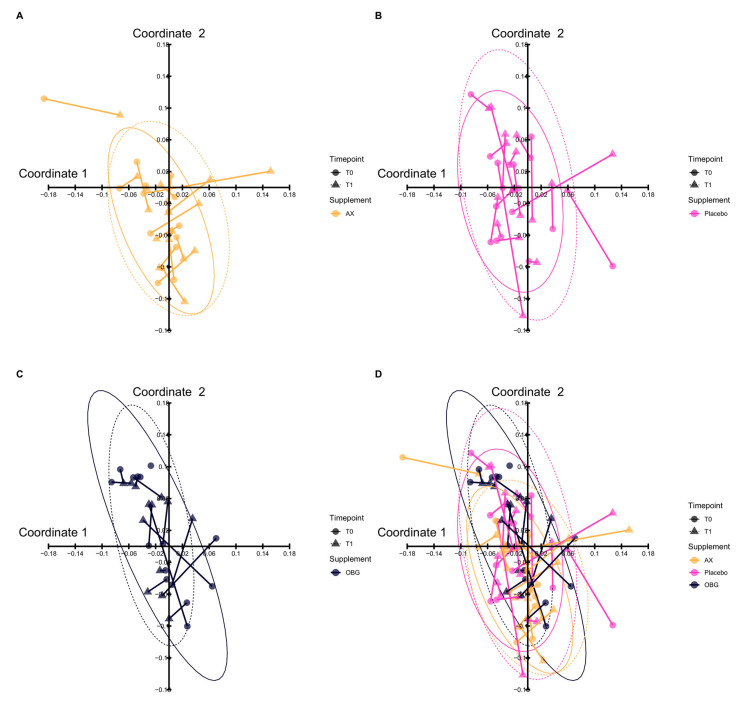
Figure 4.
The composition of gut microbiota before and after intervention was visualized by Principal Coordinates Analysis (PCoA). The panels show gut microbial composition before and after intervention with (A) AX (Arabinoxylan) (B) Placebo and (C) OBG (Oat β-Glucan). In panel (D) an overlap of all interventions is displayed. The time points of sampling are indicated by shape: circle for T0, baseline and triangle for T1, end of study. To show the composition before and after intervention a line was drawn between samples from the same patient. One outlier per intervention group is not shown in the figure. As illustrated in panel (D), no separation of the groups could be observed after intervention.

