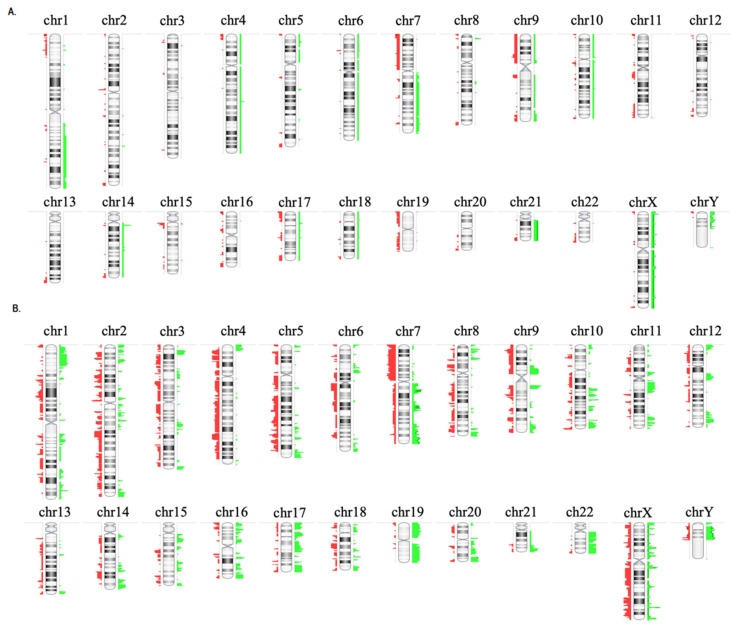
Figure 2.
Copy number alterations observed in 13 paired diagnostic/relapse samples. (A) CNAs observed in all samples at diagnosis, (B) CNAs observed in all samples at relapse. To the right of each chromosome the regions with gains are shown in green and to the left the regions with losses are shown in red.

