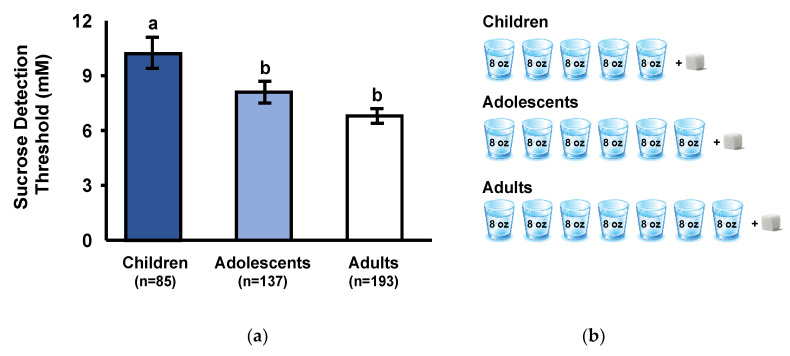
Figure 1.
(a) Sucrose taste detection thresholds: concentration of sucrose (mM) at which children, adolescents, and adults detected a taste different from water. There was a significant effect of age group (p < 0.001). Different subscripts represent groups that are significantly different from each other at p < 0.05. Values are presented as GeoMeans ± GeoSE (see Section 2.4 for explanation). (b) To illustrate the age-related differences in sucrose detection thresholds, we converted millimolar concentrations of each age group to the number of 8-ounce (230 mL) glasses of water required to dilute one 4 g sugar cube, in all cases we rounded up.

