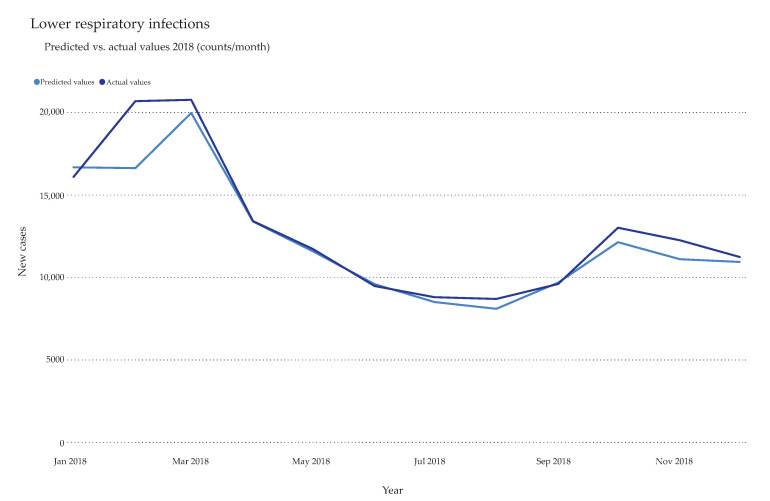
Figure 3.
Holdout validation. Exemplary comparison between predicted total cases of lower respiratory infections and actual total cases extracted from the data set. The year 2018 was selected as holdout to test the model performance. All hospitalized lower respiratory infections cases in Romania (actual values) were plotted on a monthly basis against the predicted values calculated by the AVG Blender model (predicted values).

