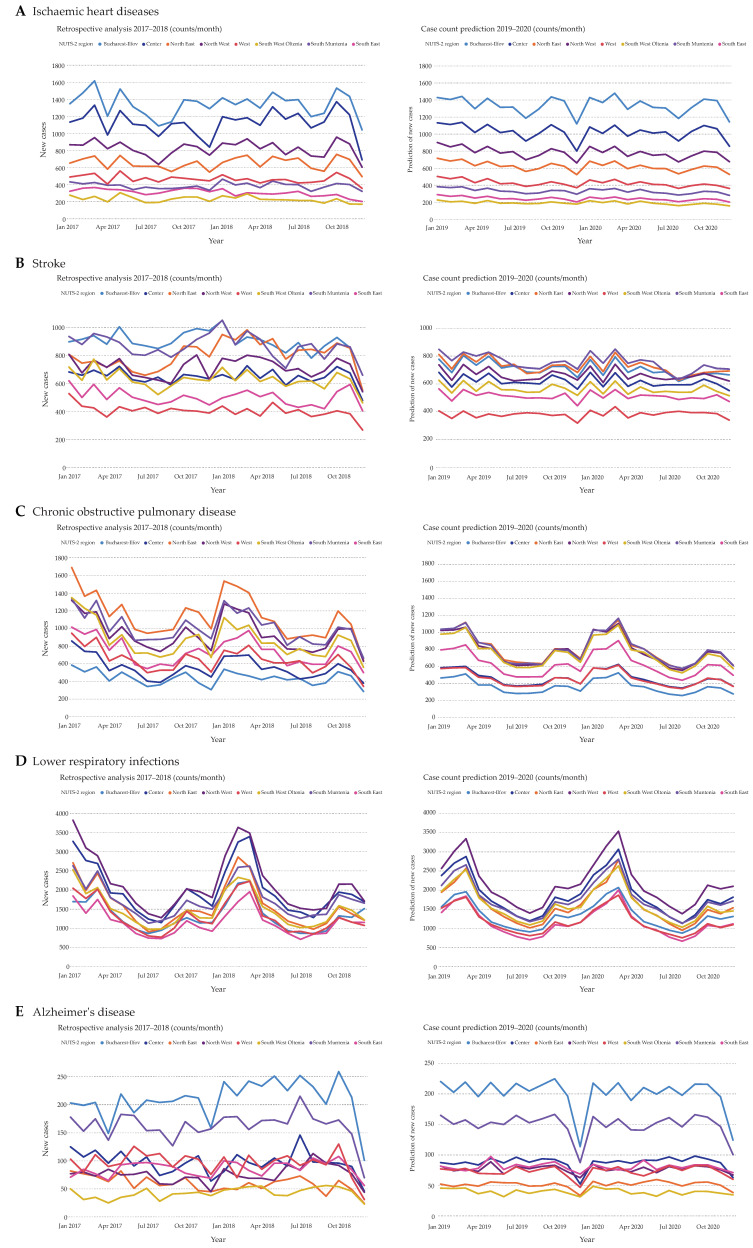
Figure 4.
Comparison between total disease cases in the years 2017 and 2018 (left side) and predicted disease cases for the years 2019 and 2020 (right side). All hospitalized cases of ischemic heart diseases (A), stroke (B), chronic obstructive pulmonary disease (C), lower respiratory infections (D), and Alzheimer’s disease (E) were plotted on a monthly basis against the predicted values.

