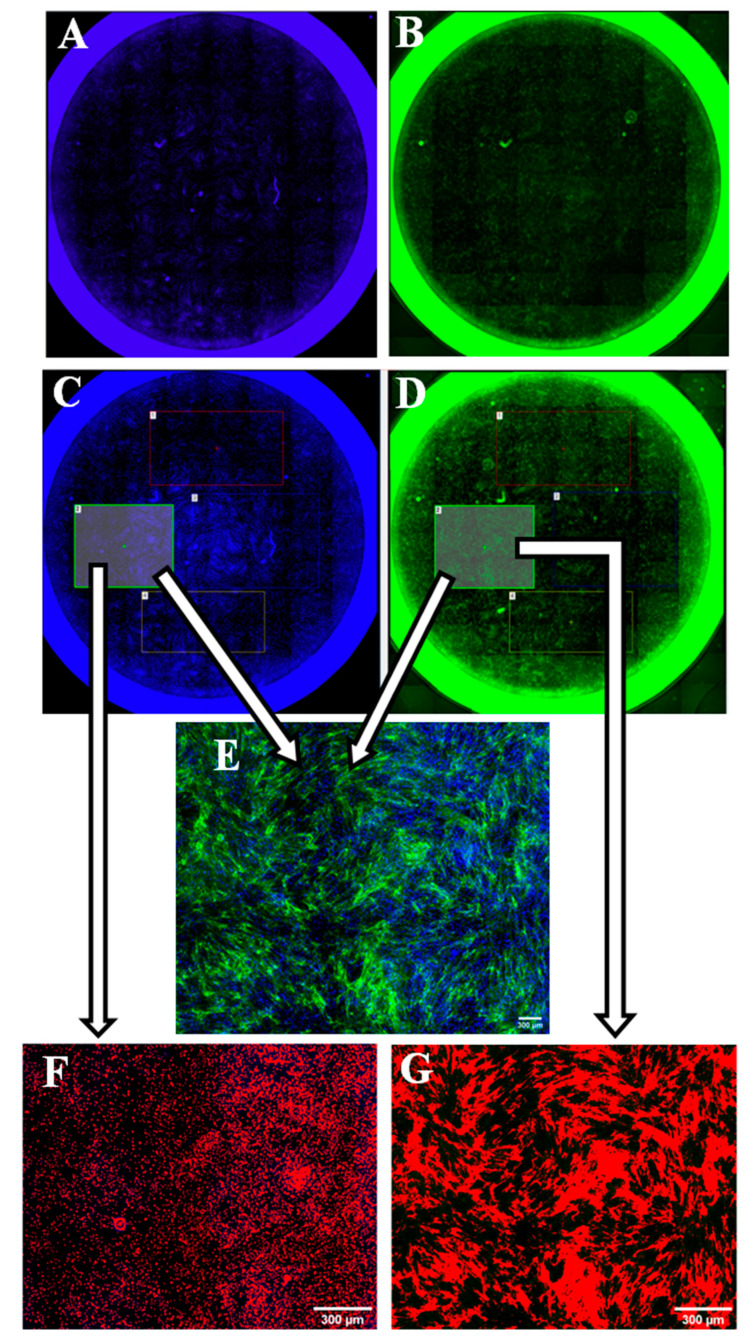
Figure 2.
Whole well imaging and collagen quantification process. The left column shows the process of counting cell nuclei (whole well imaging (A), regions of interest (ROI) selection (C), and nuclei count (F)). The right column shows the process of measuring the collagen binary area (whole well imaging (B), ROI selection (D), and collagen threshold (G)). (E): collagens and nuclei merged.

