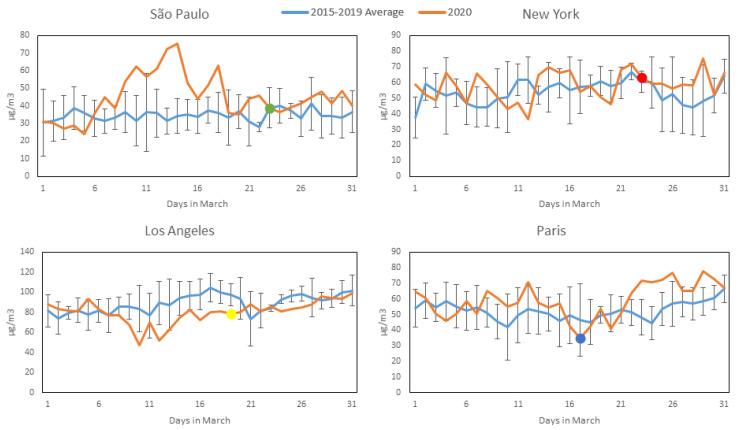
Figure 4.
O3 concentration profiles during March 2020 (Orange) compared to average and standard deviation of March concentrations over the previous 5 years (Blue) for the four studied cities (most significant COVID-19 intervention date indicated with colored dot). All available station data used for each city (see Section 2.2).

