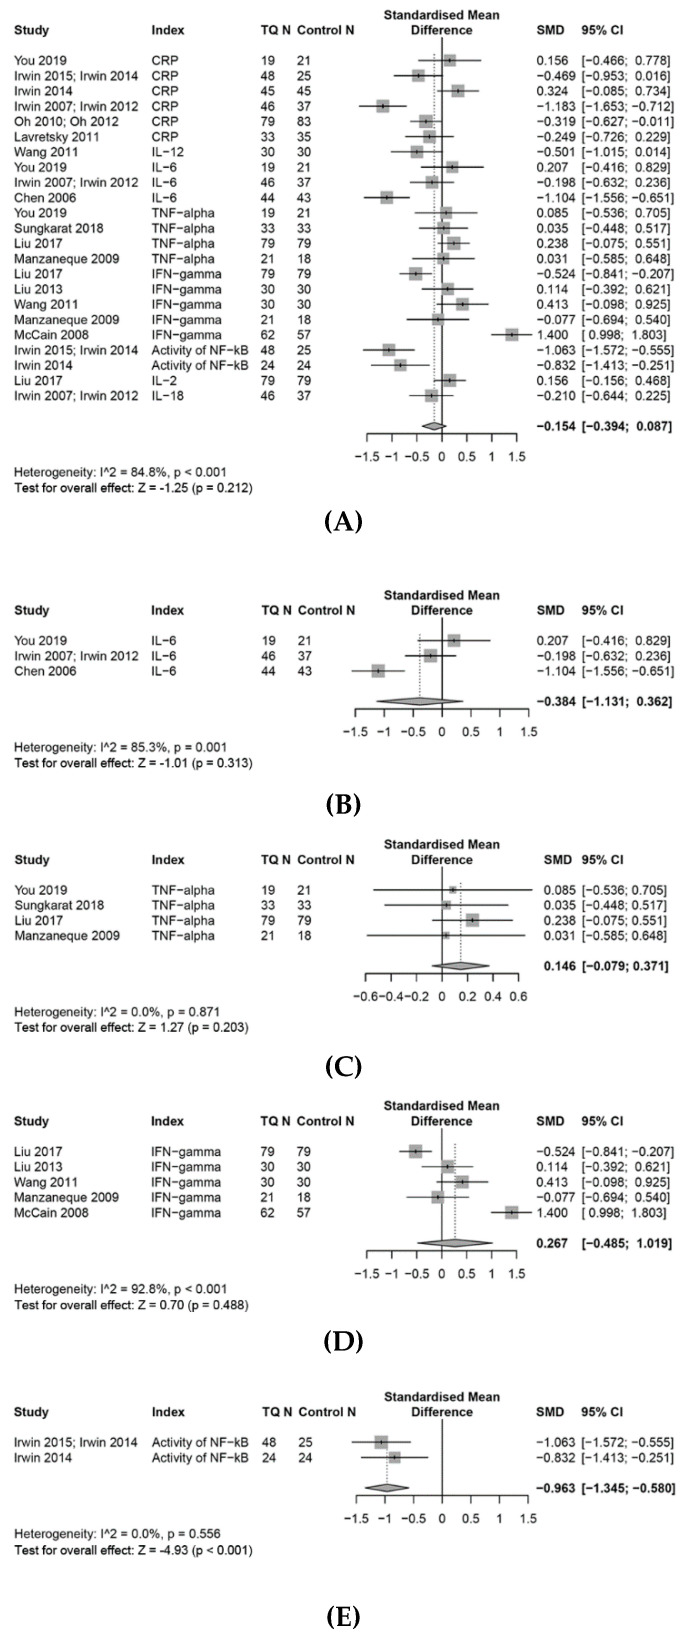
Figure 5.
Forest plot for random-effects meta-analysis of the effects of TQ on the inflammation response. (A): The effects on the inflammation response, (B): the effects on the levels of IL6, (C): the effects on the levels of TNF-α, (D): the effects on the levels of IFN-γ, (E): the effects on the activity of NF-κB.

