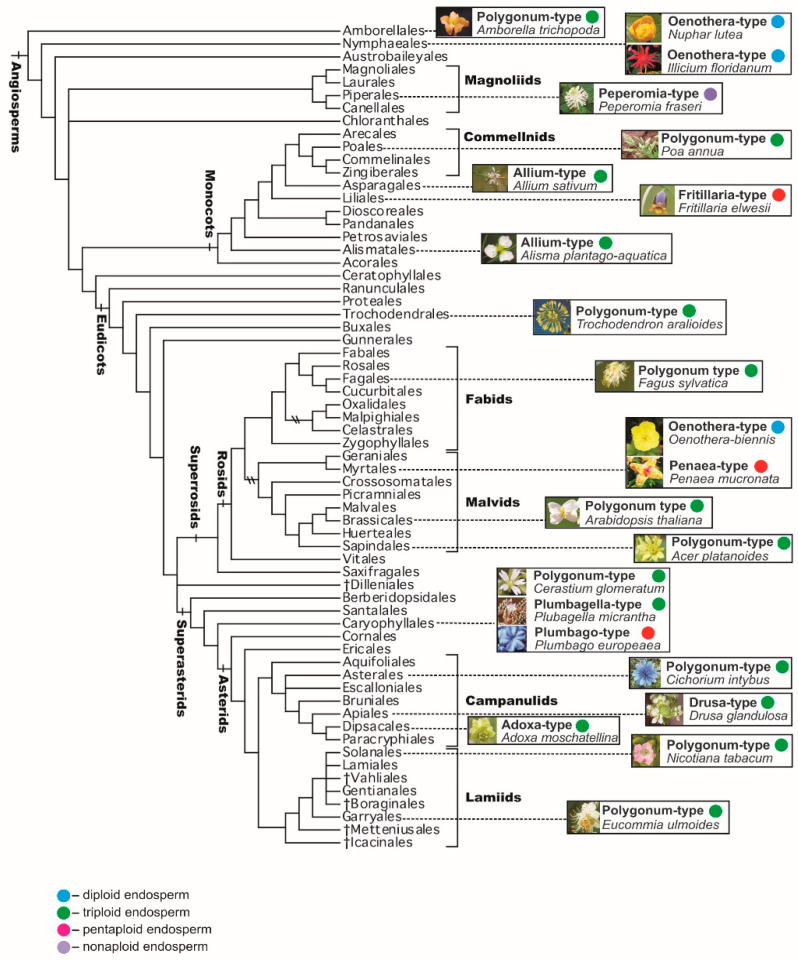
Figure 6.
A schematic representation (selected examples only) of the distribution of the main types of embryo sacs and, consequently, endosperm ploidy levels, through a phylogenetic tree based on Angiosperm Phylogeny Group IV (APG IV, 2016) [69]. Further details and examples are provided in the text.

