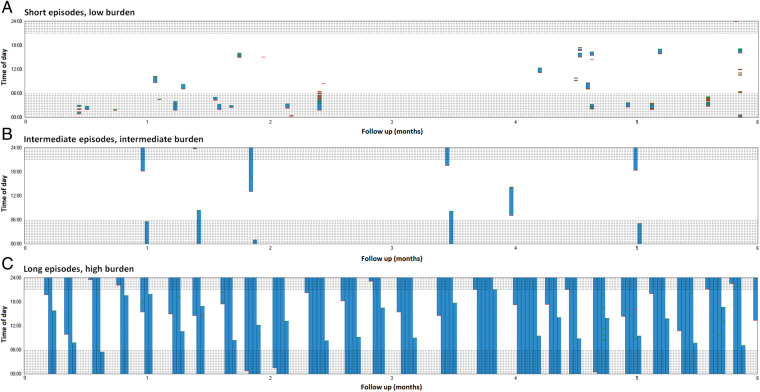
Figure 1.
Examples of patients with short (A), intermediate (B), and long (C) episodes during 6-month follow-up. Each day is represented by a bar. White means no AF is present, and blue represents ongoing episodes of AF. AF initiations are shown in red and AF terminations are shown in green. Shaded areas indicate nightly hours. The Y-axis is the time of day and the X-axis represents 6 months of follow-up. AF, atrial fibrillation.

