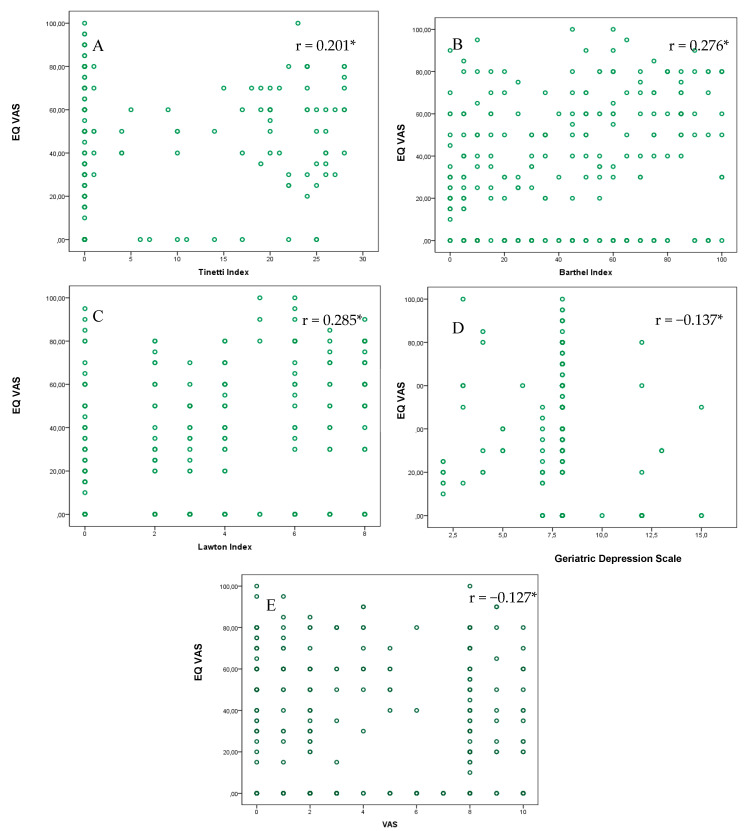
Figure 2.
Scatter plot between the EQ VAS and the scales included in the Comprehensive Geriatric Assessment. (A) Tinetti Index (0–28: lower scores = more dependence in mobility). (B) Barthel Index (0–100: lower scores = more dependence in ADLs). (C) Lawton Index (0–8: lower scores = more dependence in IADLs). (D) The Geriatric Depression Scale GDS (0–10: higher scores = more depression). (E) The visual analog scale VAS (1–10: higher scores = more pain). * p < 0.001; ** p < 0.05

