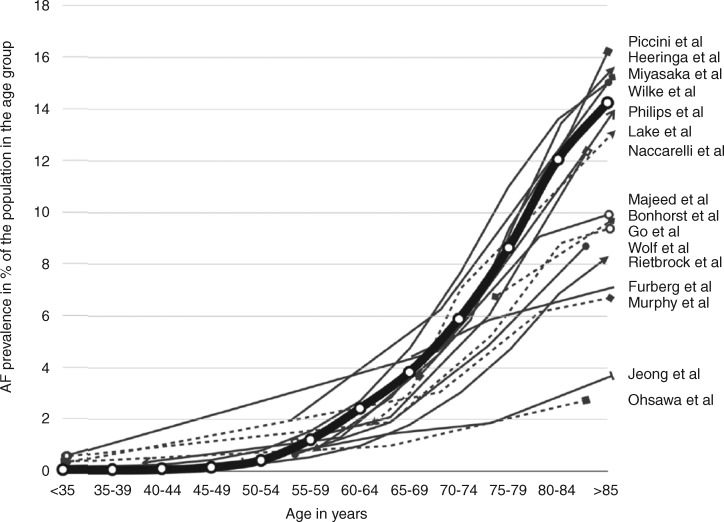
Figure 1.
A depiction of the atrial fibrillation prevalence distribution found by each study published to date.151 This depiction uses the sex-specific average rates of AF prevalence, grouped by age. The thick line represents average AF prevalence rates by age group, as derived from a pooled analysis of the individual studies weighted by sample size. (Adapted from Andrade et al. Circ Res 2014.) AF, atrial fibrillation.

