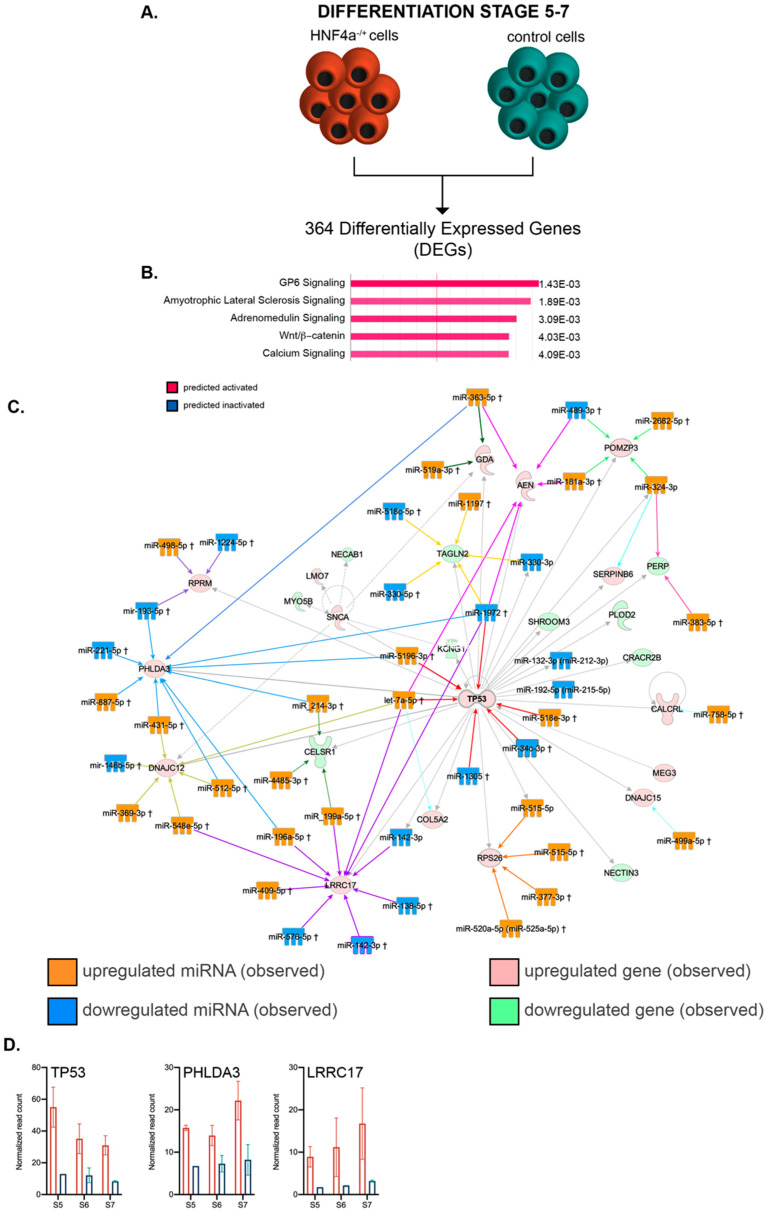
Figure 6.
Pathway analysis of the mRNA–miRNA landscapes during the late differentiation period. (A) Experimental design. (B) IPA-generated top canonical pathways (absolute value z-score greater than 1). (C) miRNA–mRNA interactions of the top transcriptional landscape network. (D) Transcript expression levels of the interaction nodes: TP53, PHLDA3 and LRRC17 at stages 5, 6 and 7 in HNF4α+/Δ (light orange) and control (green) lines (n = 2–6 samples per time-point).

