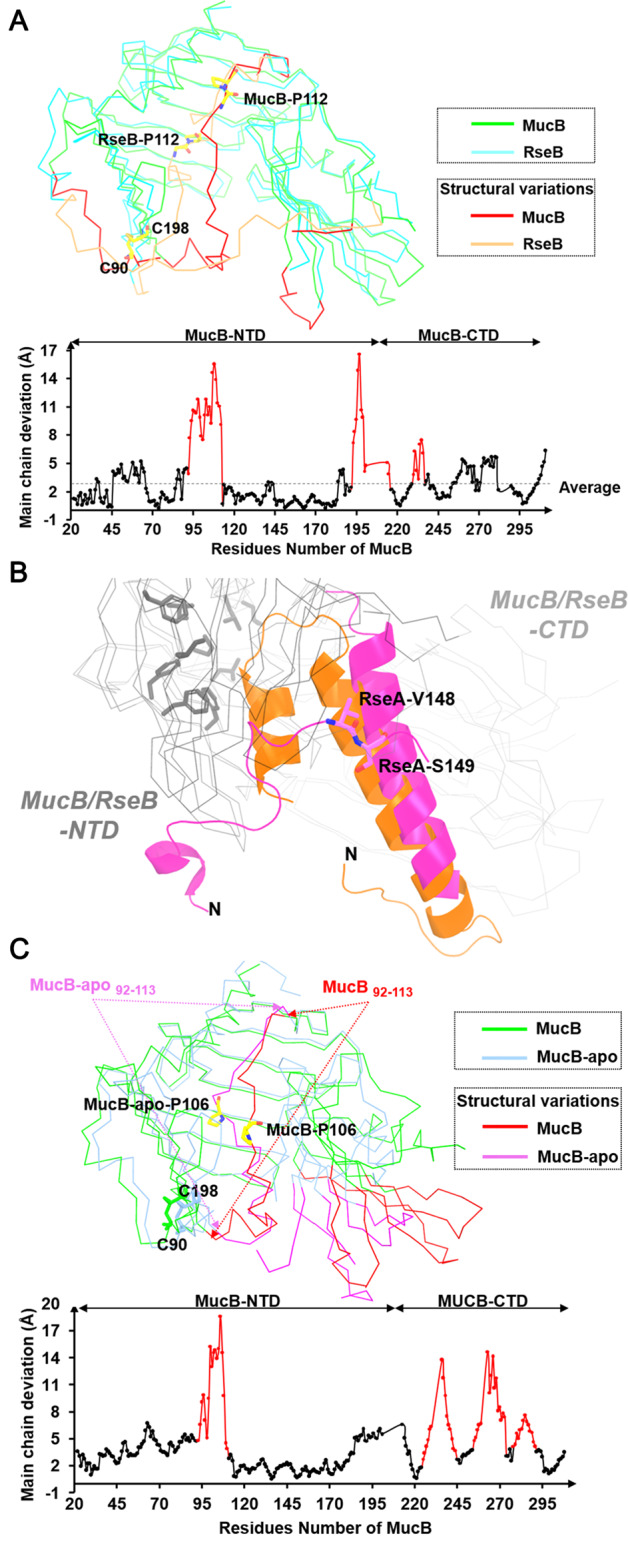
Fig. 2. Structural comparisons of MucB and RseB.

a Overview of superimposed structures (top) and the Cα RMSD (root mean square deviation) plots (bottom) of MucB and RseB. The loop regions (residues 92–113, residues 192–216, and residues 230–237 in MucB) that generate most structural variations between MucB and RseB are shown in red and orange. Conserved proline residues are shown as yellow sticks. b Superimposed structure of MucAperi–MucB and RseAperi–RseB. MucAperi, RseAperi are shown as orange and magenta cartoon. The site (V148/S149) of RseAperi degradation by DegS was shown with sticks and colored in magenta. The NTD and CTD of MucB/RseB are displayed in gray ribbon. The hydrophobic amino acids (L28/L31/F40/F44/I57/L151/F176/F178) in the hydrophobic side of MucB are displayed in gray sticks. c Overview of superimposed structures (top) and the Cα RMSD (root mean square deviation) plots (bottom) of MucB and MucB-apo (6IN8). The loop regions (residues 92–113, residues 225–245, residues 247–275, and residues 279–291 in MucB) that generate most structural variations between MucB and MucB-apo are shown in red and magenta. Proline-106 (P106) is displayed with yellow sticks.
