Figure 1.
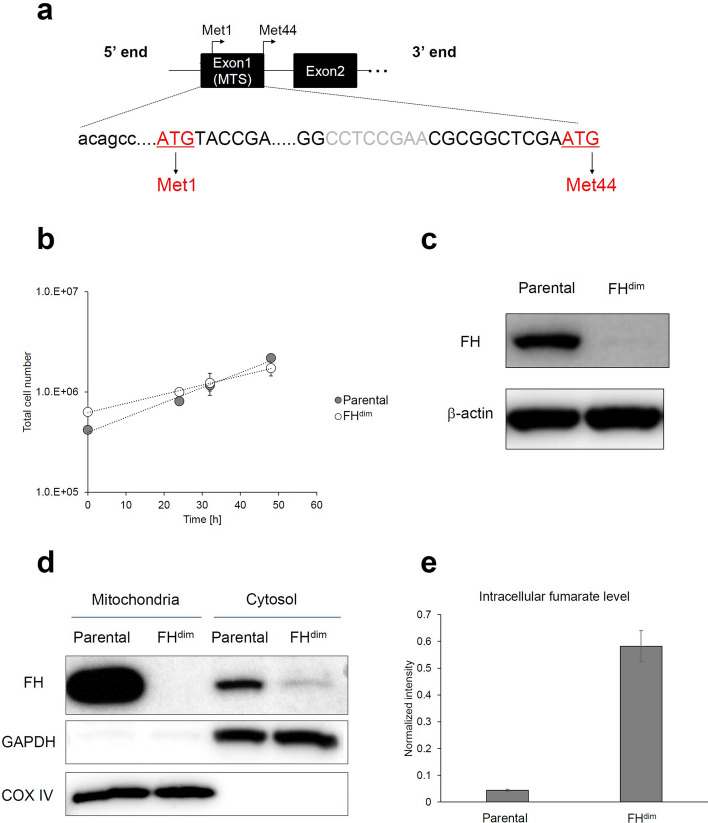
Characterization of FHdim cells. (a) Schematic representations of the FH gene. Exon 1 contains mitochondrial targeting sequence (MTS). Capital letters and grey letters represent FH coding sequence and deleted sequence in FHdim cells, respectively. (b) Growth curves of parental and FHdim cells. (c) FH protein expression of parental and FHdim cells. β-Actin was used as an internal control. (d) Mitochondrial and cytosolic FH expression. Glyceraldehyde-3-phosphate dehydrogenase (GAPDH) and cytochrome C oxidase subunit 4 (COX IV) were used as cytosolic and mitochondrial markers, respectively. In (c) and (d), cropped images were displayed. Full uncropped blots are presented in Supplemental Figure S3. (e) Intracellular fumarate levels in parental and FHdim cells. Each data point, bar chart and error bar represent the mean and standard deviation from triplicate samples.

