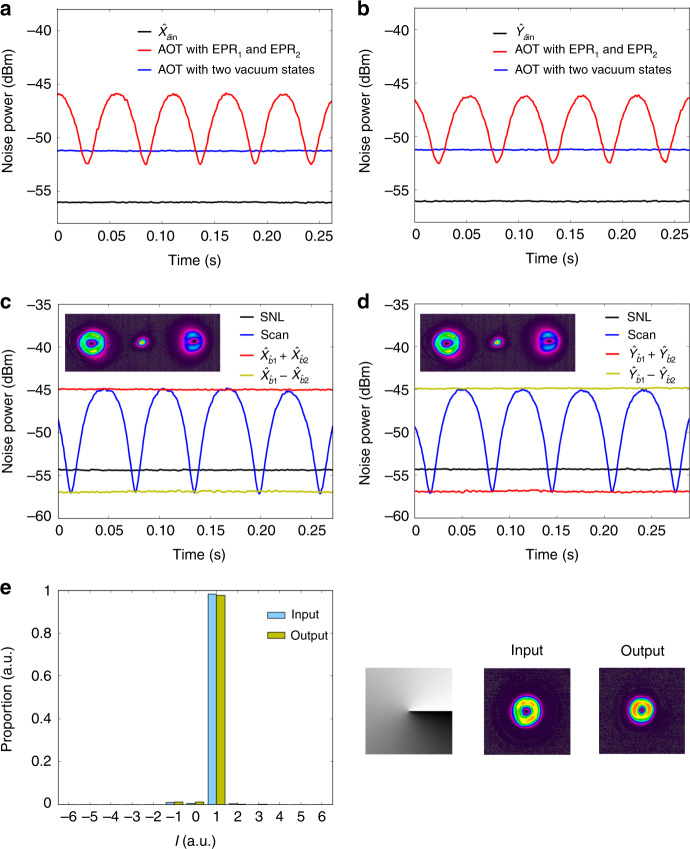
Fig. 3. The quadrature variances of the retrieved state for ℓ = 1.
a, b The variance of amplitude (phase) quadrature of the retrieved state. c, d The amplitude (phase) quadrature measurement of the orbital angular momentum (OAM) multiplexed entanglement source. The yellow trace is the variance of amplitude (phase) quadrature difference. The red trace is the variance of amplitude (phase) quadrature sum. The blue curve is noise power of the photocurrents output from balanced homodyne detection (BHD) versus the scanning phase. The black trace represents the corresponding shot noise limit (SNL). The insets show the transverse pattern of the output field when the four-wave mixing (FWM) is seeded by a bright beam. The left, center, and right beams are , Gaussian pump beam, and , respectively. e The results of OAM mode analysis. The computer-generated hologram for ℓ = 1 case and the corresponding images of input and output fields are shown on the right inset, respectively.

