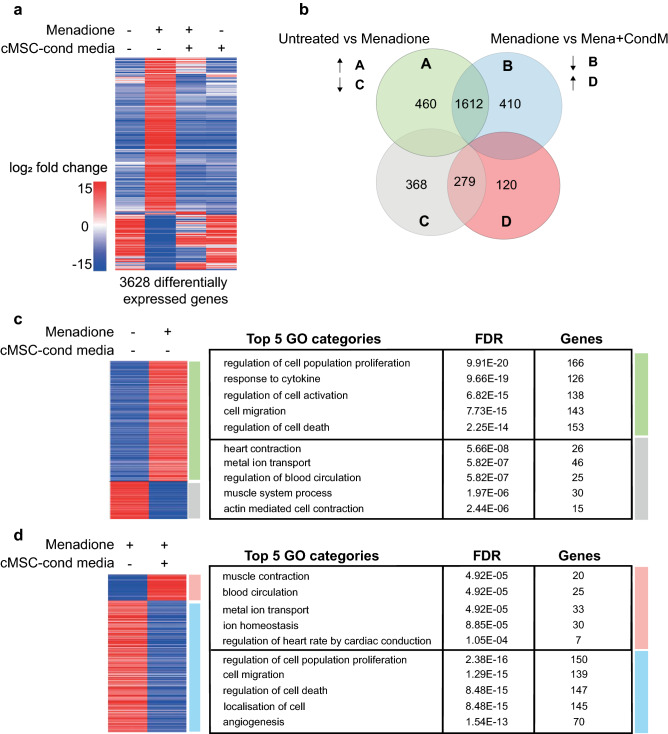
Figure 2.
RNA-Seq analysis of IMR90-cardiomyocytes ± menadione and cMSC-conditioned medium. (a) Heatmap of the 3,628 differentially expressed genes (log2fold change > 2, p value < 0.05) across the four IMR90-CM treatment groups (n = 3), shown by unsupervised cluster analysis. Oxidative stress was induced for 24 h with 20 μM menadione with and without cMSC-conditioned medium treatment. The heatmap was created in SeqMonk using Pearson’s Correlation clustering for the genes (y-axis). (b) Venn diagram showing overlapping genes shared in the pairwise comparisons indicated. Green, up-regulated genes vs untreated; grey, down-regulated genes vs untreated; blue, up-regulated genes vs menadione-stressed; red, down-regulated genes vs menadione-stressed. (c,d) Curated heatmaps and tables of GOs for the changes induced by (c) menadione or (d) cMSC-conditioned medium. Tables include top 5 non-redundant GOs, from the ToppGene “Biological Process” database. For a full list of the generated GOs see Supplementary Fig. S7. These data were deposited on SRA public repository with accession number PRJNA629893.

