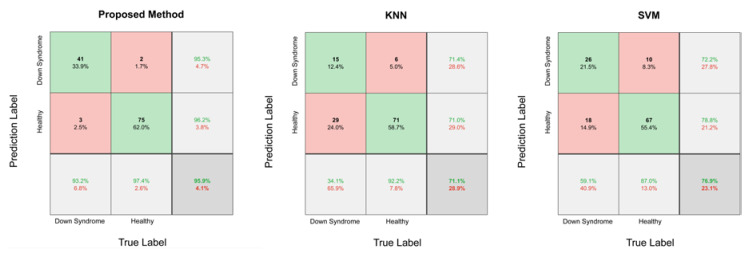
Figure 4.
Confusion matrix of the proposed method, k-Nearest Neighbors (KNN), and support vector machine (SVM). Green squares denote the correctly classified cases, red squares denote the incorrectly classified cases, gray squares denote the identification results in rows/columns, and deep grey ones denote the Down syndrome identification results. Green numbers represent the correct rates, and red numbers represent the error rates.

