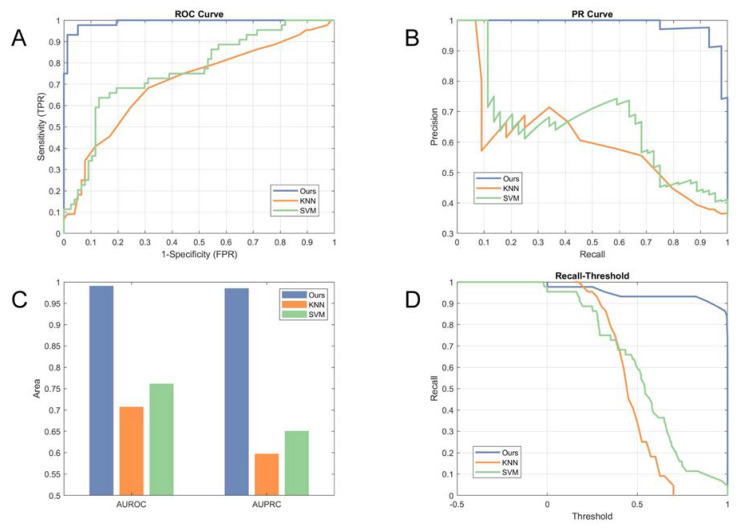
Figure 5.
Comparison with state-of-the-art methods: (A) Comparison in a receiver operating characteristic (ROC) curve; (B) comparison in a precision-recall curve (PR curve); (C) comparison in area under the receiver operating characteristic curves (AUROC) and area under the precision-recall curve (AUPRC); and (D) illustration in the recall of methods vs. varying normalized score thresholds.

